Fig. A.23.
Download original image
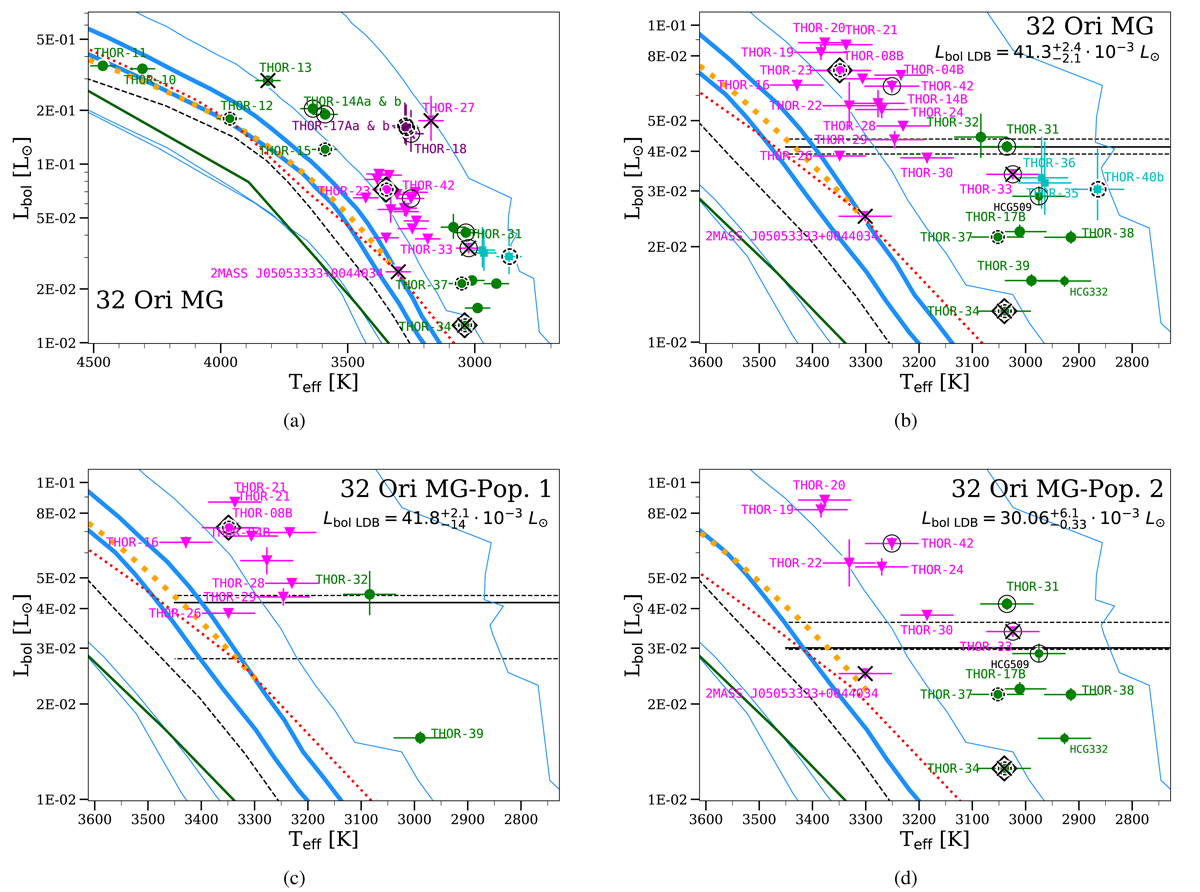
HRDs and the LDB for the 32 Ori MG. (a) The same as in Fig. 6 but for 32 Ori MG. Empty black diamonds correspond to fast rotators. Thin blue lines correspond to isochrones of 1, 10, 100 Ma, and 1 Ga from the BT-Settl models (Allard et al. 2013), while the thick blue lines to a 20 and 30 Ma. The figure includes 20 Ma isochrones from Siess et al. 2000 (red dotted line), and D’Antona & Mazzitelli 1994 (black dashed line). It also includes a 18 Ma isochrone from Tognelli et al. 2011 (orange dashed dot line). (b) Zoom on the previous plot around the LDB. We added the sources HCG 332 and HCG 509 (see Section 2.12). The 32 Ori MG is ![]() Ma old using the BT-Settl bolometric luminosity-age relationship (Allard et al. 2012). (c) Zoom on the LDB for 32 Ori MG population 1, see Appendix D. The 32 Ori MG population 1 is
Ma old using the BT-Settl bolometric luminosity-age relationship (Allard et al. 2012). (c) Zoom on the LDB for 32 Ori MG population 1, see Appendix D. The 32 Ori MG population 1 is ![]() Ma (BT-Settl models from Allard et al. 2012). (d) Zoom on the LDB for 32 Ori MG population 2, see Appendix D. Thin blue lines correspond to isochrones of 1, 10, 100 Ma, and 1 Ga from the BT-Settl models (Allard et al. 2013), while the thick blue one to 30 Ma. The figure includes: a 25 Ma isochrone from Siess et al. 2000 (red dotted line), a 20 Ma isochrone from D’Antona & Mazzitelli 1994 (black dashed line), and a 20 Ma isochrone from Tognelli et al. 2011 (orange dashed dot line). The 32 Ori MG population 2 is
Ma (BT-Settl models from Allard et al. 2012). (d) Zoom on the LDB for 32 Ori MG population 2, see Appendix D. Thin blue lines correspond to isochrones of 1, 10, 100 Ma, and 1 Ga from the BT-Settl models (Allard et al. 2013), while the thick blue one to 30 Ma. The figure includes: a 25 Ma isochrone from Siess et al. 2000 (red dotted line), a 20 Ma isochrone from D’Antona & Mazzitelli 1994 (black dashed line), and a 20 Ma isochrone from Tognelli et al. 2011 (orange dashed dot line). The 32 Ori MG population 2 is ![]() Ma (BT-Settl models from Allard et al. 2012).
Ma (BT-Settl models from Allard et al. 2012).
Current usage metrics show cumulative count of Article Views (full-text article views including HTML views, PDF and ePub downloads, according to the available data) and Abstracts Views on Vision4Press platform.
Data correspond to usage on the plateform after 2015. The current usage metrics is available 48-96 hours after online publication and is updated daily on week days.
Initial download of the metrics may take a while.