Fig. 4.
Download original image
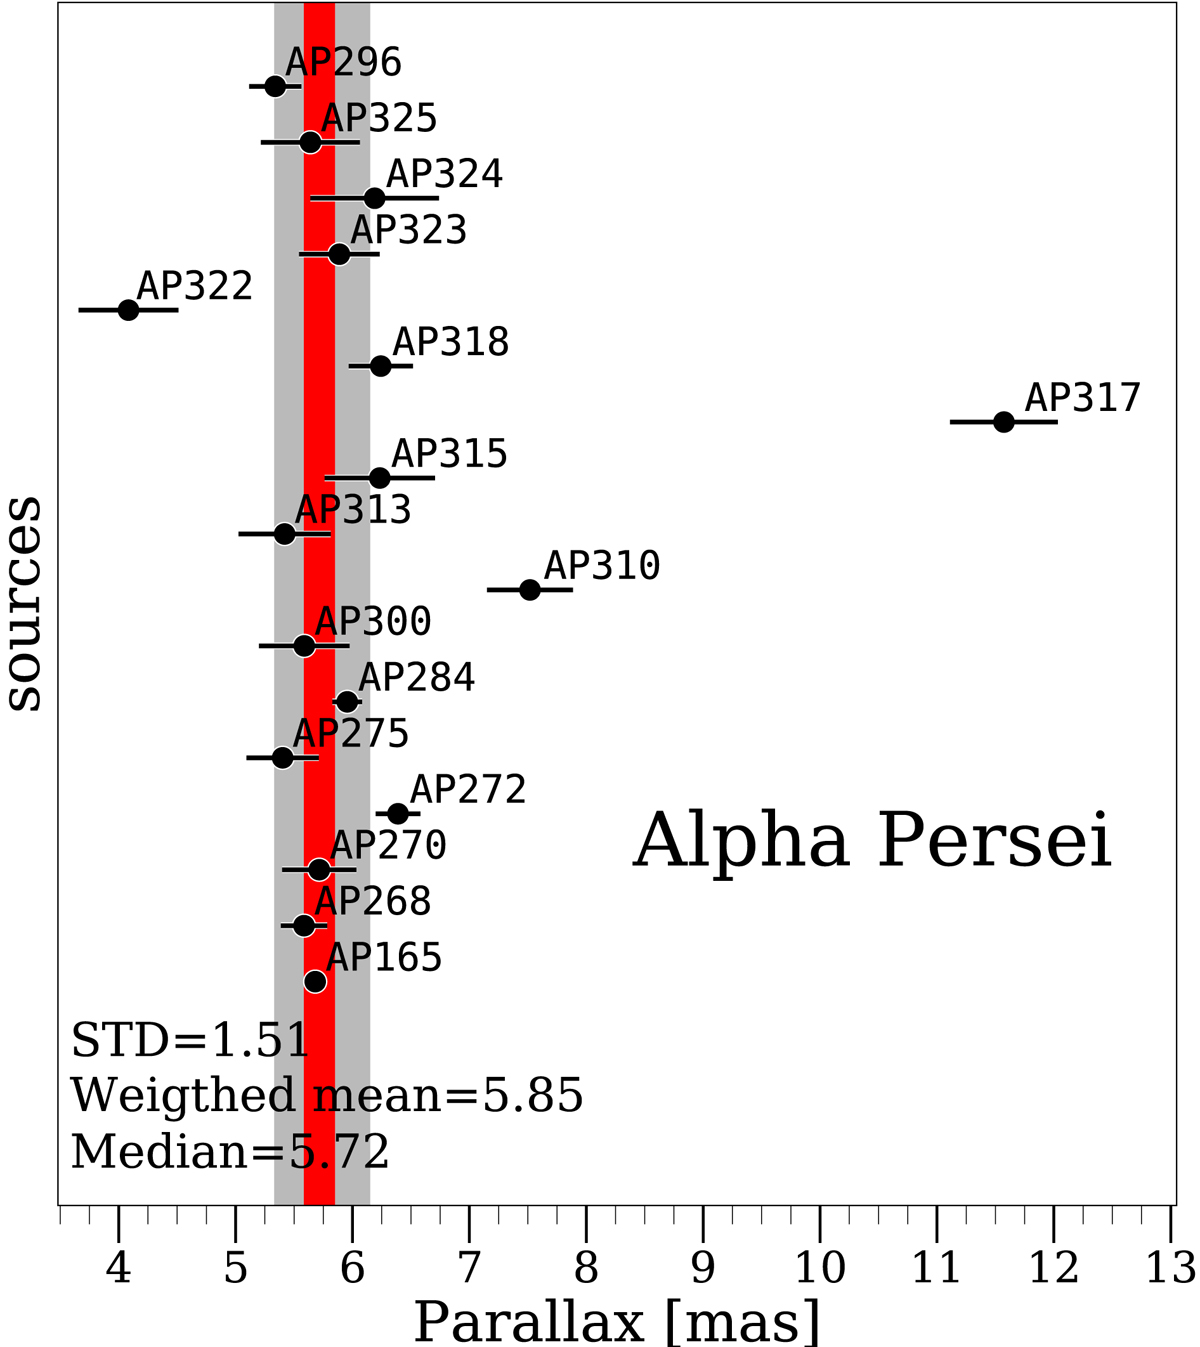
Parallaxes for 17 selected Alpha Persei sources close to the LDB. The grey filled area shows the parallax distribution from Gaia Collaboration (2018b) between the percentiles 2.5th and 97.5th, while the distribution quartiles are delimited by a red filled area superimposed. All the parallaxes have been taken from the Gaia DR2 catalogue. The standard deviation (STD), the weighted mean, and the median of the LDB sample are also displayed.
Current usage metrics show cumulative count of Article Views (full-text article views including HTML views, PDF and ePub downloads, according to the available data) and Abstracts Views on Vision4Press platform.
Data correspond to usage on the plateform after 2015. The current usage metrics is available 48-96 hours after online publication and is updated daily on week days.
Initial download of the metrics may take a while.