Fig. D.1.
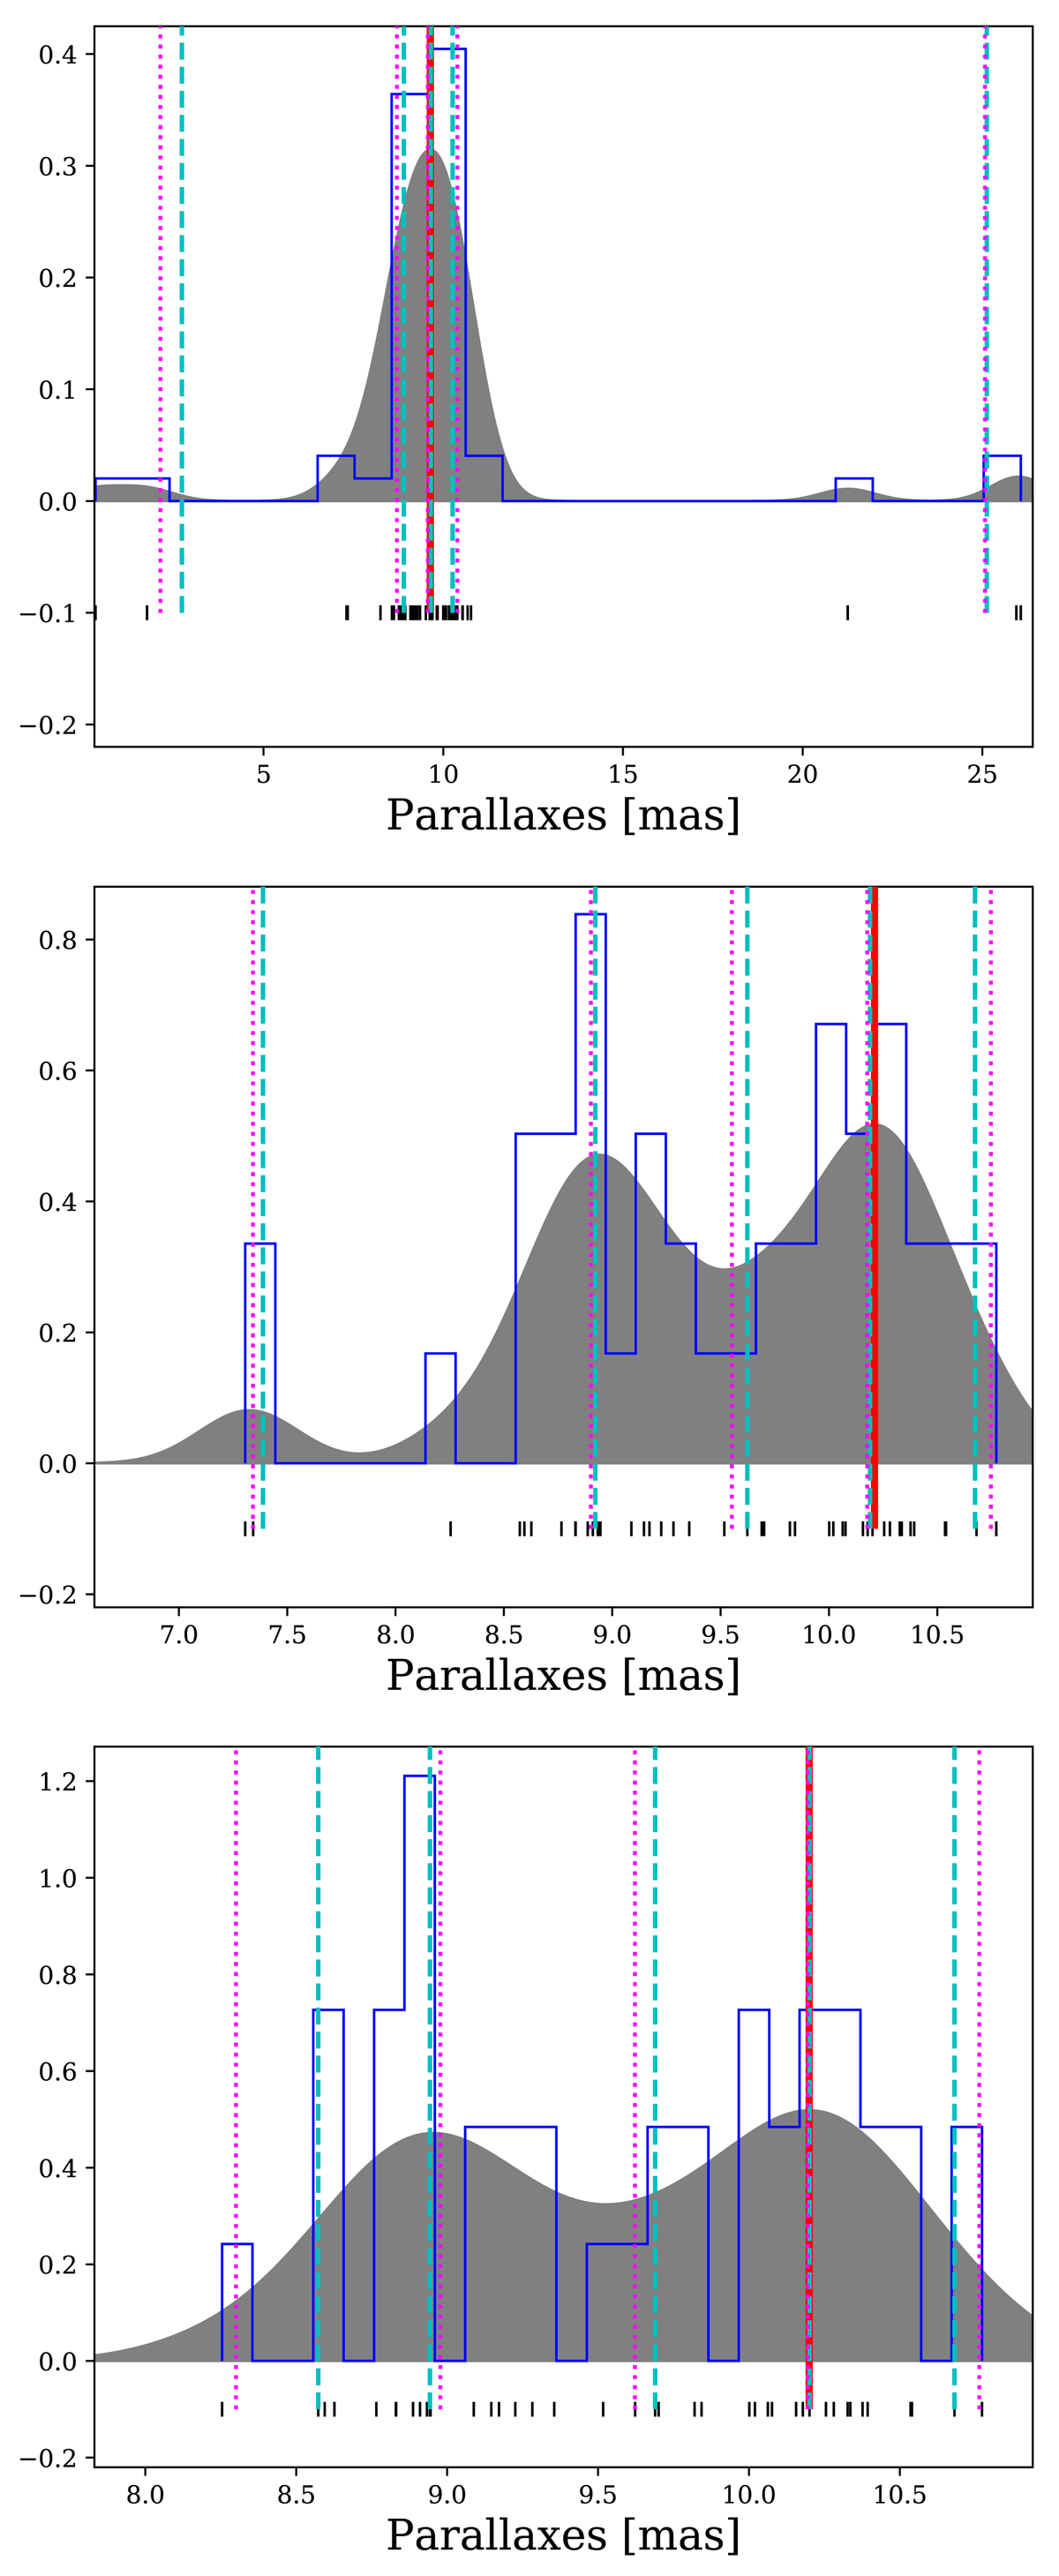
Download original image
Parallax PDF for the 32 Ori MG known members (taken from Bell et al. 2017). The modelled PDF is shown in gray and a superimposed histogram in blue. The cyan vertical dashed lines point the percentiles of the raw data at the 2.5th, 25th, 50th, 75th, and 97.5th. The magenta vertical dotted lines point the same percentiles as before but calculated from the modelled KDE. The red vertical line shows the mode of the PDF. The small vertical black lines below the horizontal axis (below y = 0.0) shows the parallaxes of each source. Top: All the previous known members from Bell et al. (2017). Middle: First iteration. Bottom: Second iteration.
Current usage metrics show cumulative count of Article Views (full-text article views including HTML views, PDF and ePub downloads, according to the available data) and Abstracts Views on Vision4Press platform.
Data correspond to usage on the plateform after 2015. The current usage metrics is available 48-96 hours after online publication and is updated daily on week days.
Initial download of the metrics may take a while.