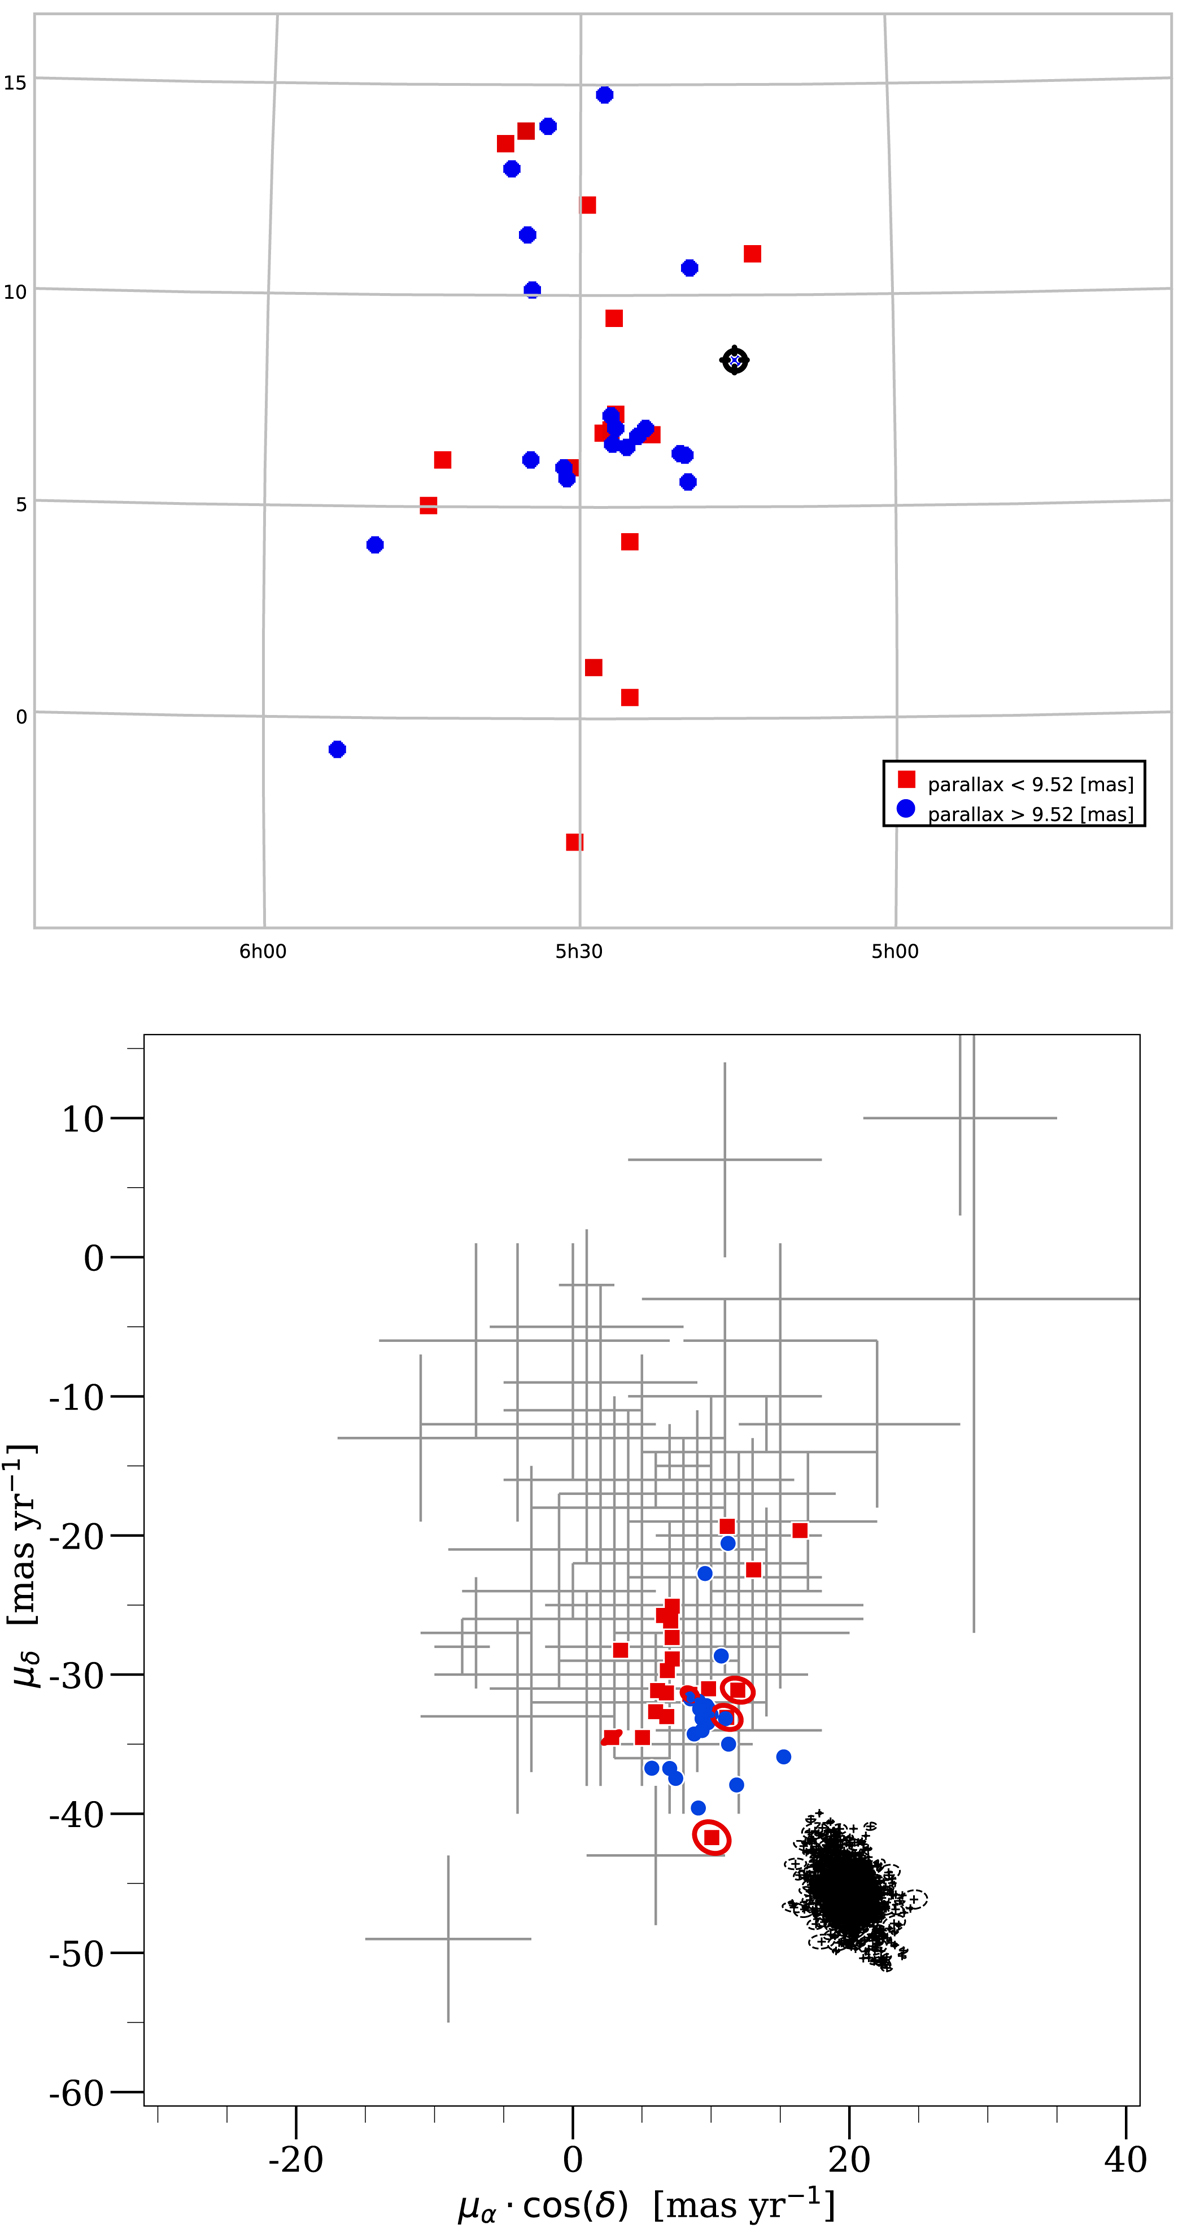
Fig. D.2.
Download original image
Spatial distribution and VPD for the 32 Ori MG members. Top: Spatial distribution of the known members from Bell et al. (2017), after removing some outliers. The two populations based on parallaxes are shown. Bottom: VPD of the 32 Ori MG, sub-sample red squares are population 1 (ϖ < 9.52 mas) and blue circles population 2 (ϖ > 9.52 mas). Black dashed ellipses are the Pleiades members taken from Gaia Collaboration 2018b and the light grey plus symbols are the Taurus-Auriga members taken from Ducourant et al. (2005). The proper motion data have been taken from the Gaia DR2 catalogue, with the exception of the Taurus sample that comes from Ducourant et al. (2005).
Current usage metrics show cumulative count of Article Views (full-text article views including HTML views, PDF and ePub downloads, according to the available data) and Abstracts Views on Vision4Press platform.
Data correspond to usage on the plateform after 2015. The current usage metrics is available 48-96 hours after online publication and is updated daily on week days.
Initial download of the metrics may take a while.