Open Access
Fig. 5.
Download original image
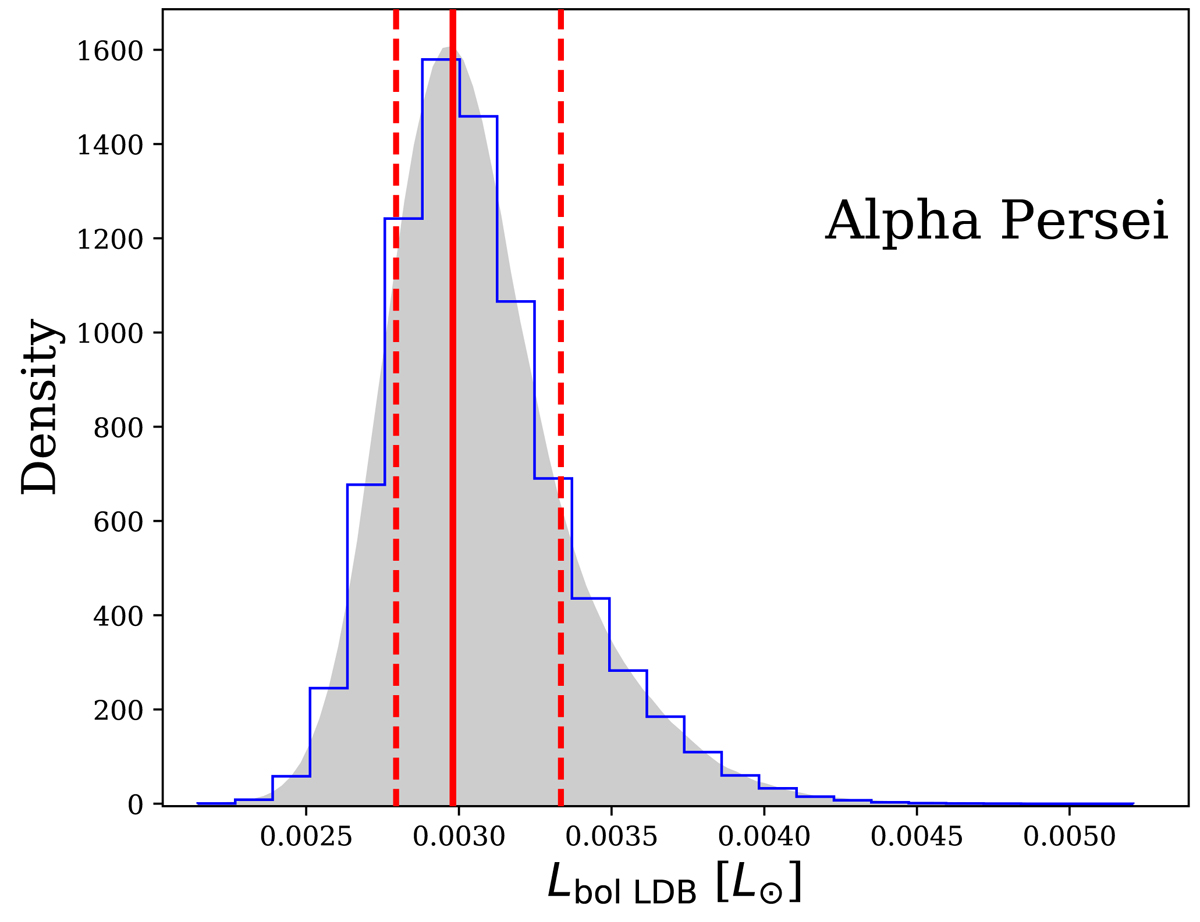
Bolometric luminosity PDF for the Alpha Persei LDB, after run 60 000 bootstrap samples, see Sect. 4.4. We show all the sample distribution as a blue histogram, and we model a PDF with all the values in grey. We highlight the mode of the PDF with a red line and the percentiles at 16th and 84th with two red dashed ones.
Current usage metrics show cumulative count of Article Views (full-text article views including HTML views, PDF and ePub downloads, according to the available data) and Abstracts Views on Vision4Press platform.
Data correspond to usage on the plateform after 2015. The current usage metrics is available 48-96 hours after online publication and is updated daily on week days.
Initial download of the metrics may take a while.