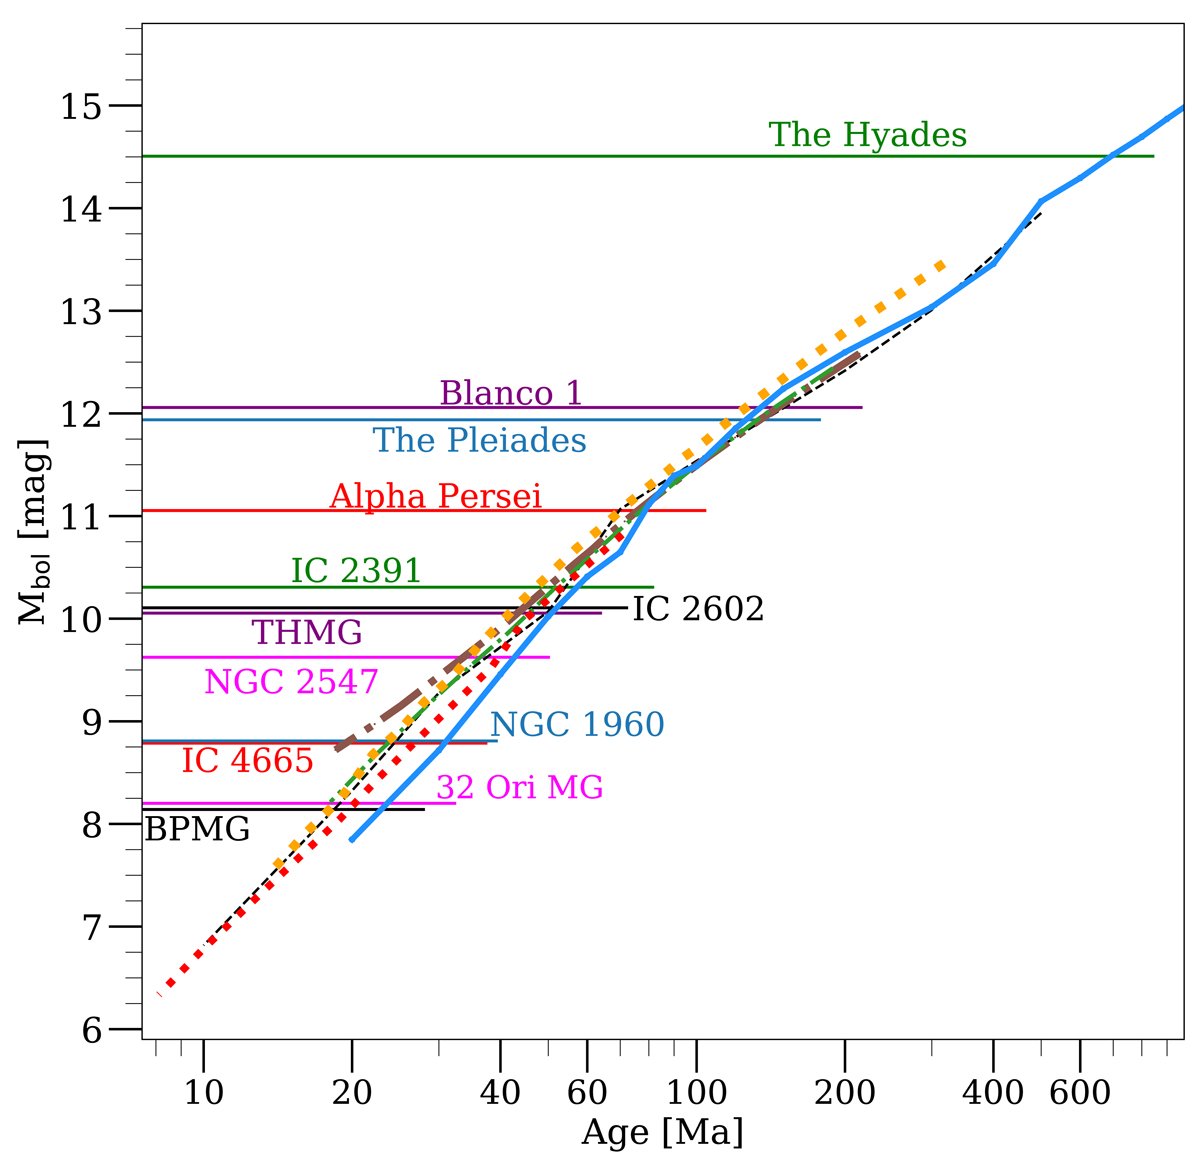
Fig. 7.
Download original image
Location of the LDB for all studied stellar associations and its relation with the age. We show bolometric magnitudes of the LDB for each stellar association as horizontal lines (several colours). Uncertainties are not shown for clarity. The lines that cross diagonally from the lower left corner to the upper right one correspond to different LDB models: the dashed black line is the D’Antona & Mazzitelli (1994) LDB, the dashed dotted brown thicker line is the Burrows et al. (1997) LDB, the dashed dotted green thinner line is the Burke et al. (2004) LDB, the dotted red line thicker corresponds to the Pisa LDB (Tognelli et al. 2015), the dotted red line thiner correspond to the Siess et al. (2000) LDB and the blue line is the BT-Settl LDB (Allard et al. 2013).
Current usage metrics show cumulative count of Article Views (full-text article views including HTML views, PDF and ePub downloads, according to the available data) and Abstracts Views on Vision4Press platform.
Data correspond to usage on the plateform after 2015. The current usage metrics is available 48-96 hours after online publication and is updated daily on week days.
Initial download of the metrics may take a while.