Fig. 4
Download original image
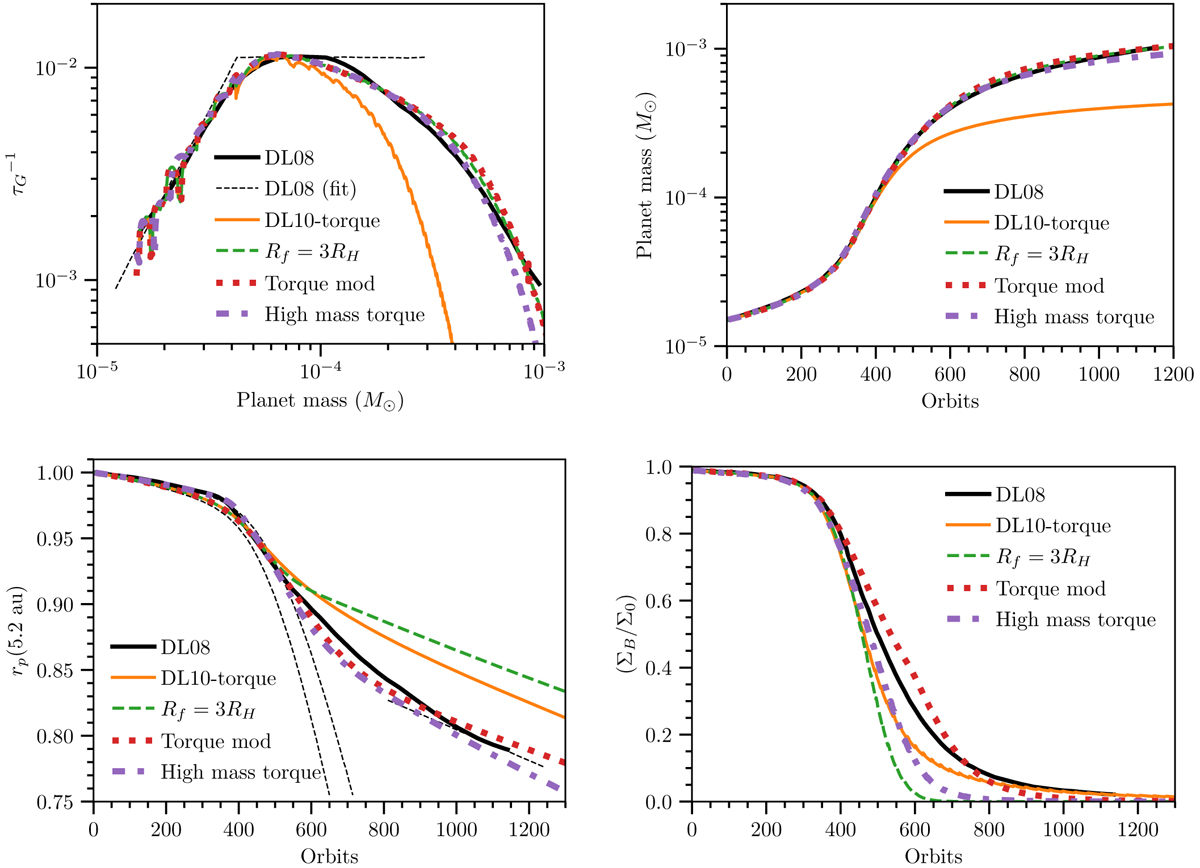
Time evolution of the baseline case with an initial surface density of 100 g cm−2 at 5.2 au. The solid black line represents the 3D result from DL08. The solid orange line corresponds to our 1D result when using the DL10 torque. The green dashed line gives again the result with the DL10 torque, but with the feeding zone radius increased threefold. The red dotted line shows a calculation where, additionally, the torque density has been modified. The purple dash-dotted line shows the variant model, where interpolated torque densities for planets of different masses from DL10 were applied. The torque densities are described in Sect. 2.3. Top left: inverse growth timescale in units of the orbital timescale at the initial location (≈12 yr). The thin black dashed line represents the fit given by Eqs. (7) and (8). Top right: mass evolution. Bottom left: orbital migration. The thin dashed black lines represent (from left to right) predictions for saturated and unsaturated type I, and type II theory. Bottom right: evolution of the mean surface density around the planet. Time is given in orbits at the planet’s initial separation (5.2 au).
Current usage metrics show cumulative count of Article Views (full-text article views including HTML views, PDF and ePub downloads, according to the available data) and Abstracts Views on Vision4Press platform.
Data correspond to usage on the plateform after 2015. The current usage metrics is available 48-96 hours after online publication and is updated daily on week days.
Initial download of the metrics may take a while.