Fig. B.1
Download original image
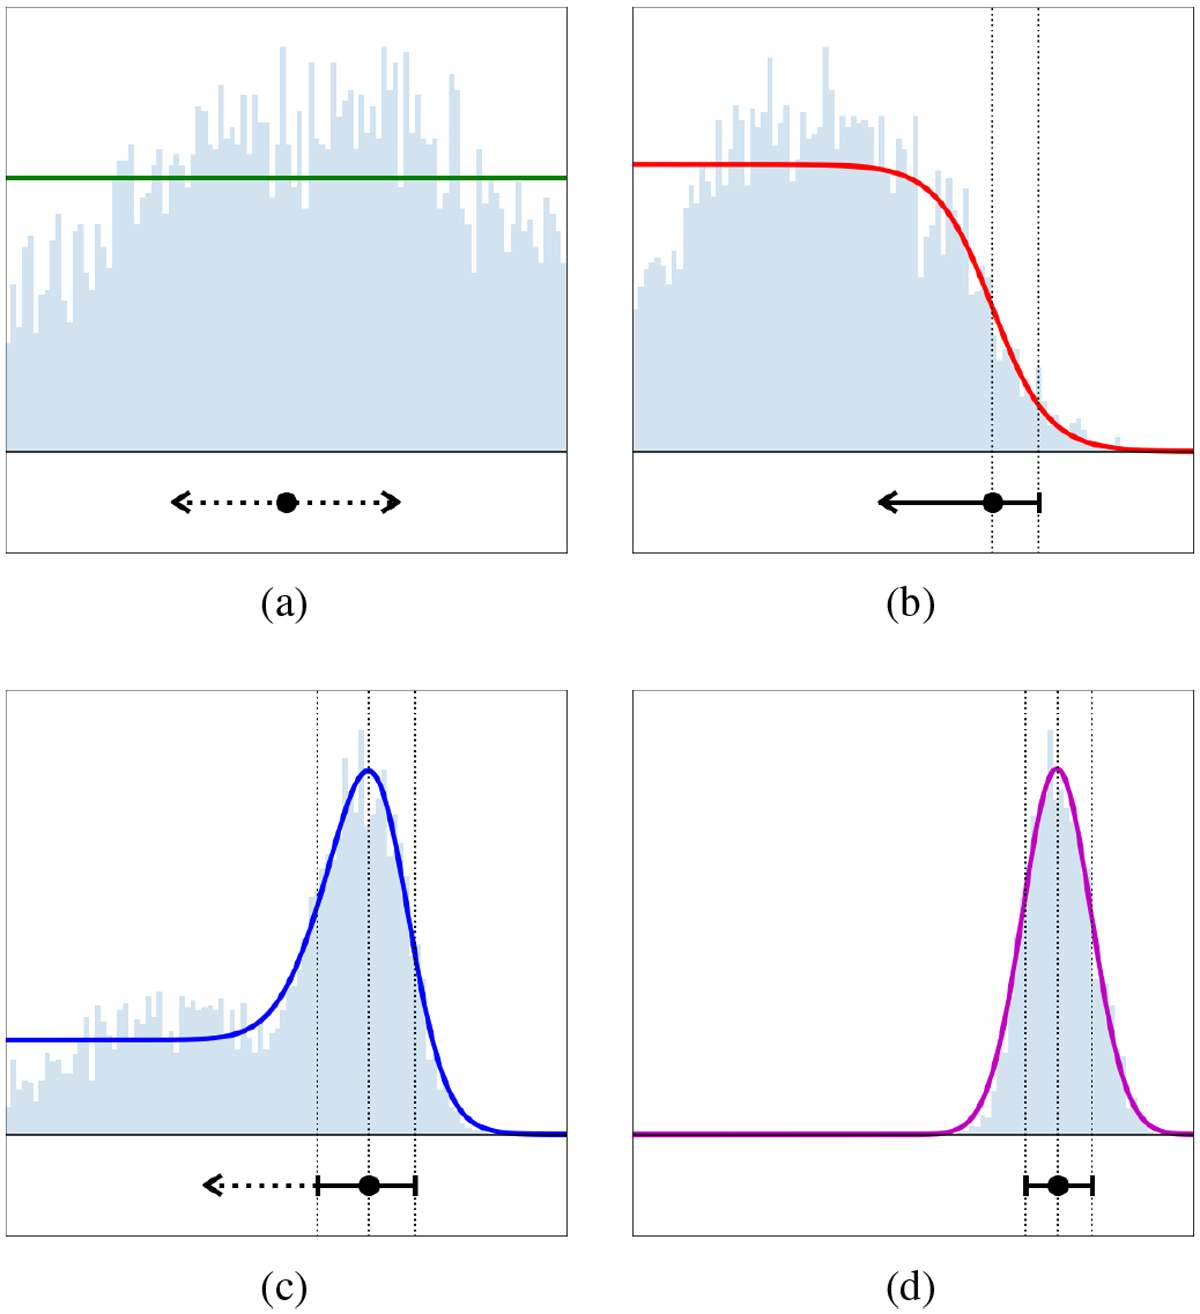
Classes of retrieved posterior distributions. The histogram gives the posterior distribution as found by the retrieval framework. The colored lines represent the best fit model for the posterior distribution, the black symbols below show how such a posterior will be represented in our data analysis plots. (a): unconstrained posterior (UC-type), (b): upper limit posterior (UL-type), (c): sensitivity limit posterior (SL-type), (d): constrained posterior (C-type).
Current usage metrics show cumulative count of Article Views (full-text article views including HTML views, PDF and ePub downloads, according to the available data) and Abstracts Views on Vision4Press platform.
Data correspond to usage on the plateform after 2015. The current usage metrics is available 48-96 hours after online publication and is updated daily on week days.
Initial download of the metrics may take a while.