Fig. 2
Download original image
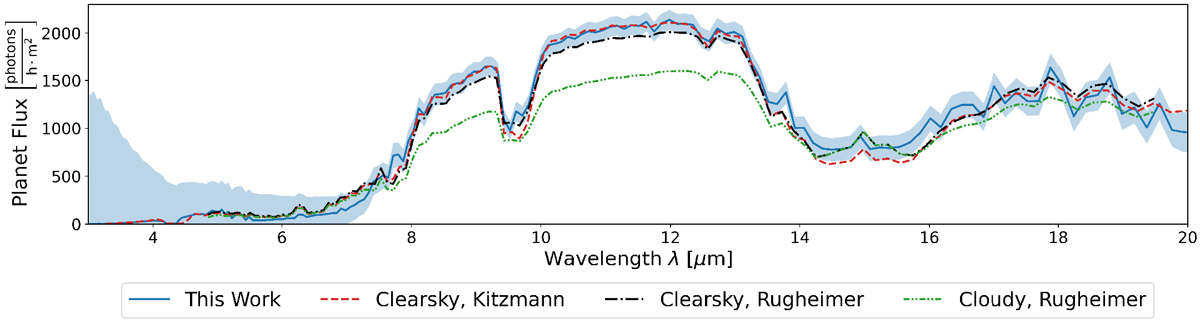
Comparison of the Earth-twin MIR emission spectra calculated with various different models. We plot the photon flux received from an Earth-twin located 10 pc from the sun. The solid blue line is the MIR thermal emission calculated with petitRADTRANS using the settings discussed in Sect. 2.3.1. The blue-shaded region indicates the most optimistic LIFEsim uncertainty (S/N = 20) used in our retrievals. The red dashed line represents a cloud-free Earth model by Daniel Kitzmann (priv. comm.), which takes scattering into account. The green and black dashed-dotted lines are the cloudy (60% cloud coverage) and cloud-free modern Earth spectra from Rugheimer et al. (2015) that account for scattering.
Current usage metrics show cumulative count of Article Views (full-text article views including HTML views, PDF and ePub downloads, according to the available data) and Abstracts Views on Vision4Press platform.
Data correspond to usage on the plateform after 2015. The current usage metrics is available 48-96 hours after online publication and is updated daily on week days.
Initial download of the metrics may take a while.