Fig. 4

Download original image
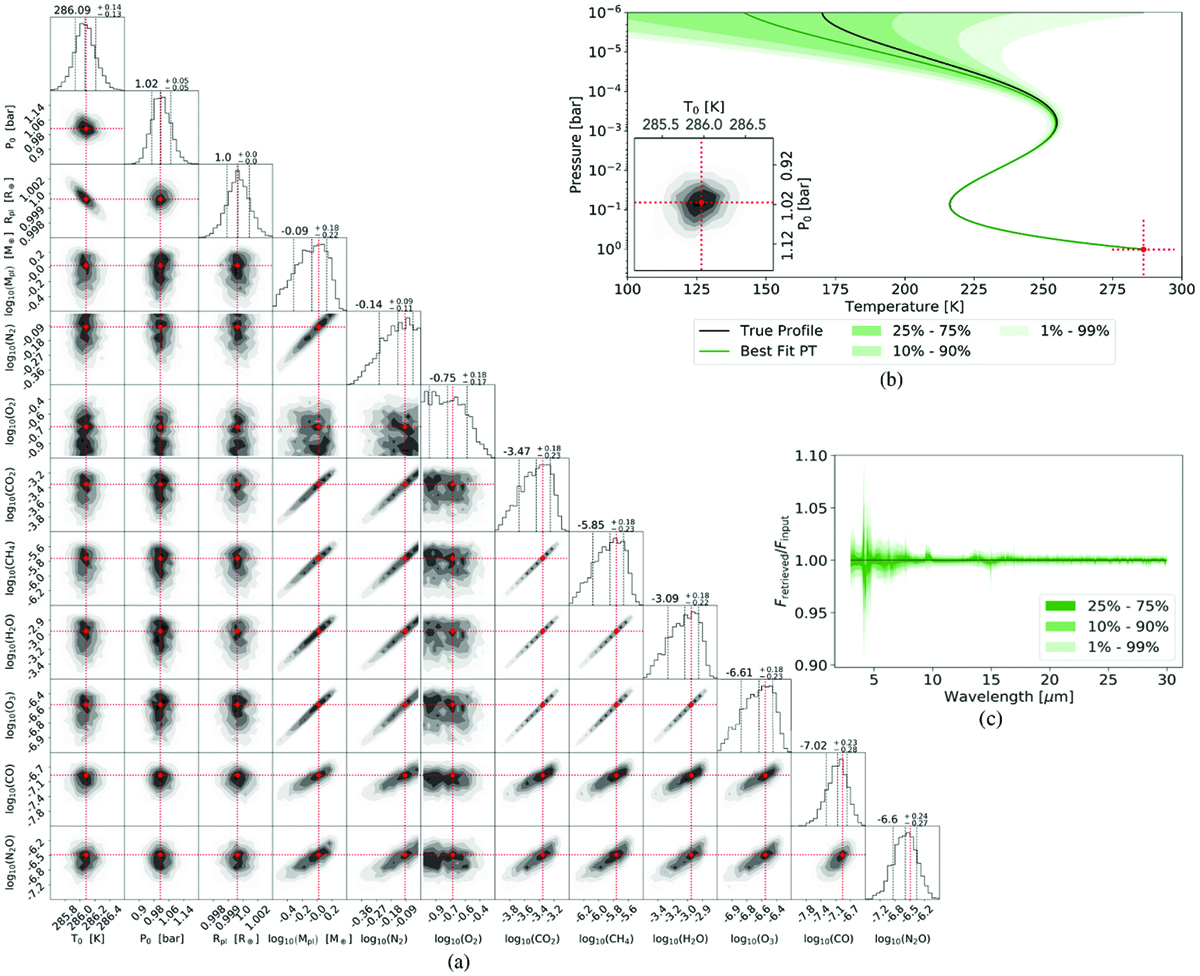
Results from the validation run outlined in Sect. 3. (a) Corner plot for the posterior distributions of the planetary surface temperature T0, surface pressure P0, radius Rpl, mass Mpl, and retrieved abundances of different molecules. The red lines indicate the values used to generate the input spectrum. Additionally, we plot the retrieved median and the 16th and 84th percentile as dashed lines in every posterior plot. (b) Retrieved P−T profile. The shaded green regions show the uncertainties on the retrieved profile. In the bottom left corner of the P−T profile plot, we display P0 and T0. The red cross marks the input values. (c) The retrieved emission spectrum Fretrieved relative to the input emission spectrum for the retrieval Finput.
Current usage metrics show cumulative count of Article Views (full-text article views including HTML views, PDF and ePub downloads, according to the available data) and Abstracts Views on Vision4Press platform.
Data correspond to usage on the plateform after 2015. The current usage metrics is available 48-96 hours after online publication and is updated daily on week days.
Initial download of the metrics may take a while.


