Fig. 6
Download original image
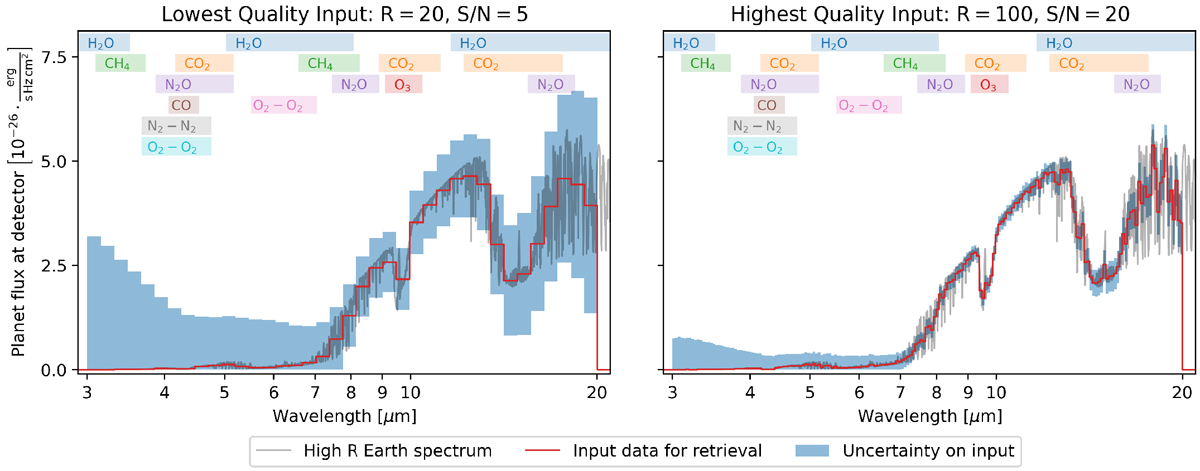
Examples of input spectra used in the grid retrievals for the nominal case (left: the lowest quality input with R = 20, S/N = 5; right: the highest quality input with R = 100, S/N = 20). In gray, we provide the full resolution petitRADTRANS Earth spectrum. The red step function represents the wavelength-binning of the input data. Further, the blue shaded region represents the uncertainty for the corresponding bin. We also mark the absorption features of the considered atmospheric gases.
Current usage metrics show cumulative count of Article Views (full-text article views including HTML views, PDF and ePub downloads, according to the available data) and Abstracts Views on Vision4Press platform.
Data correspond to usage on the plateform after 2015. The current usage metrics is available 48-96 hours after online publication and is updated daily on week days.
Initial download of the metrics may take a while.