Fig. 6
Download original image
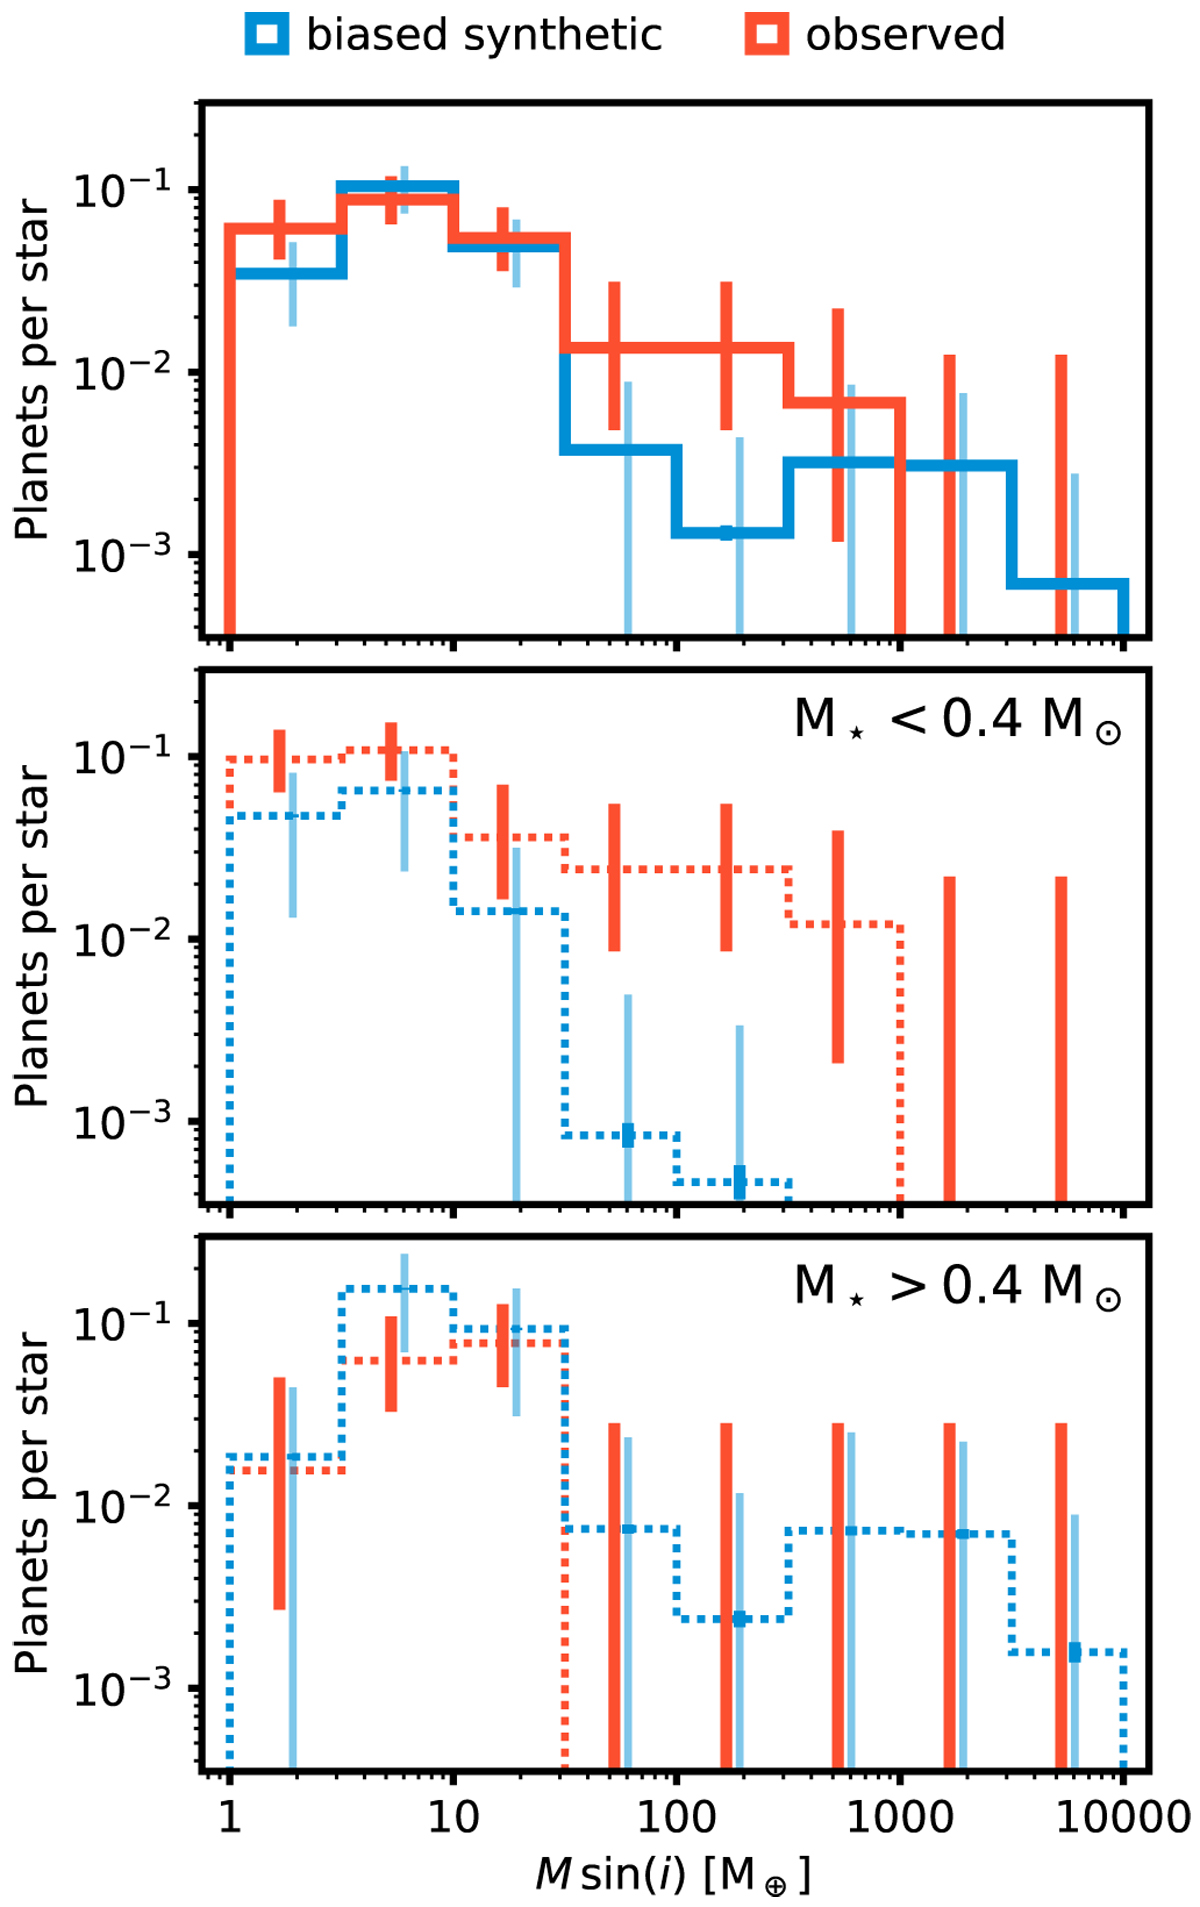
Minimum mass distribution of synthetic and observed planets. Thick vertical lines show 68% confidence intervals based on the binomial distribution. Thin blue lines show standard deviations of 2000 bootstrapped synthetic samples, where each sample had the size of the observed sample. Top: total normalized counts. The distribution of the biased synthetic population appears bimodal in M sin(i). The observed sample shows a peak in the terrestrial planet regime of a few Earth masses and a continuous downward slope without a valley. At low masses, the theoretical and observed distributions agree. The formation model underproduces planets ≳30 M⊙ and features a “sub-Saturn valley.” Center and bottom: normalized counts for late (<0.4 M⊙) and early (>0.4 M⊙) M dwarfs separately. At minimum masses beyond ~30 M⊙, theory and observations disagree: while observed subgiant and giant planets occur mostly around stars with masses ~0.3 M⊙, the formation model produces such planets only around more massive stars.
Current usage metrics show cumulative count of Article Views (full-text article views including HTML views, PDF and ePub downloads, according to the available data) and Abstracts Views on Vision4Press platform.
Data correspond to usage on the plateform after 2015. The current usage metrics is available 48-96 hours after online publication and is updated daily on week days.
Initial download of the metrics may take a while.