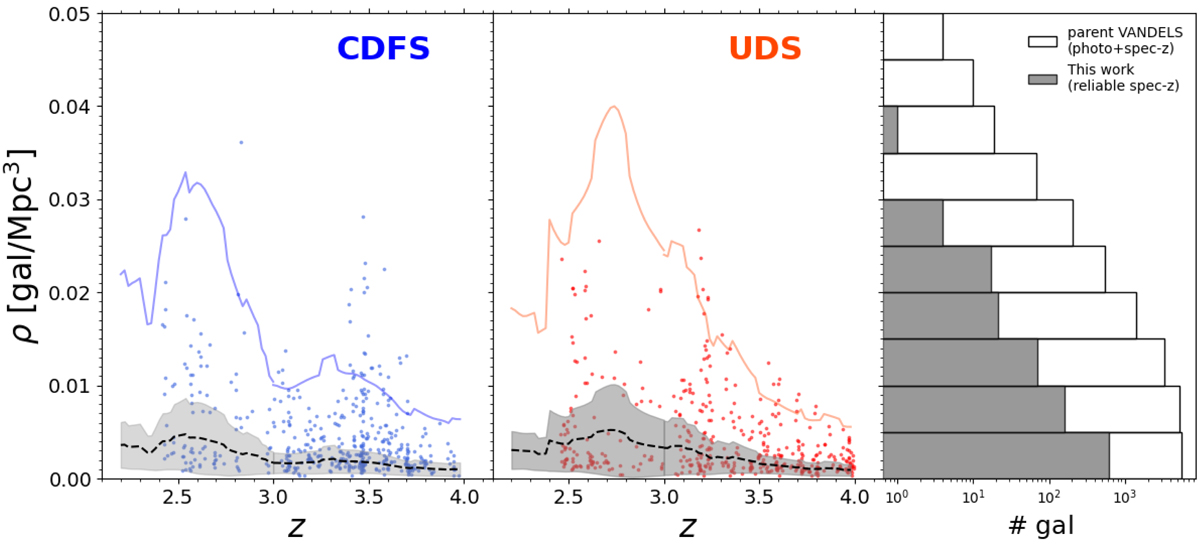
Fig. 1.
Download original image
Local galaxy density distribution of VANDELS galaxies. Left and middle: redshift (z) vs. local galaxy density (ρ) for the galaxies with reliable spectroscopic redshifts (z-flag ≥ 3) used to test the environmental effects on the MZR, in the CDFS and UDS fields, respectively with blue and orange dots. This is only a subset of the parent VANDELS sample used to calculate the galaxy density maps. The black dashed line and the gray shaded region represent for each z the median local density ρmed(z) and the corresponding standard deviation, respectively. The colored continuous lines highlight instead the criterion adopted to consider galaxies as members of an overdensity structure: > 6σ above the median density. Right: histogram distribution of the local galaxy density for the VANDELS sample used in this work (both fields). The white empty bars show the local density distribution of the parent VANDELS sample (having both photometric and spectroscopic z) used for the calculation of the density and for the identification of overdense structures.
Current usage metrics show cumulative count of Article Views (full-text article views including HTML views, PDF and ePub downloads, according to the available data) and Abstracts Views on Vision4Press platform.
Data correspond to usage on the plateform after 2015. The current usage metrics is available 48-96 hours after online publication and is updated daily on week days.
Initial download of the metrics may take a while.