Fig. 6.
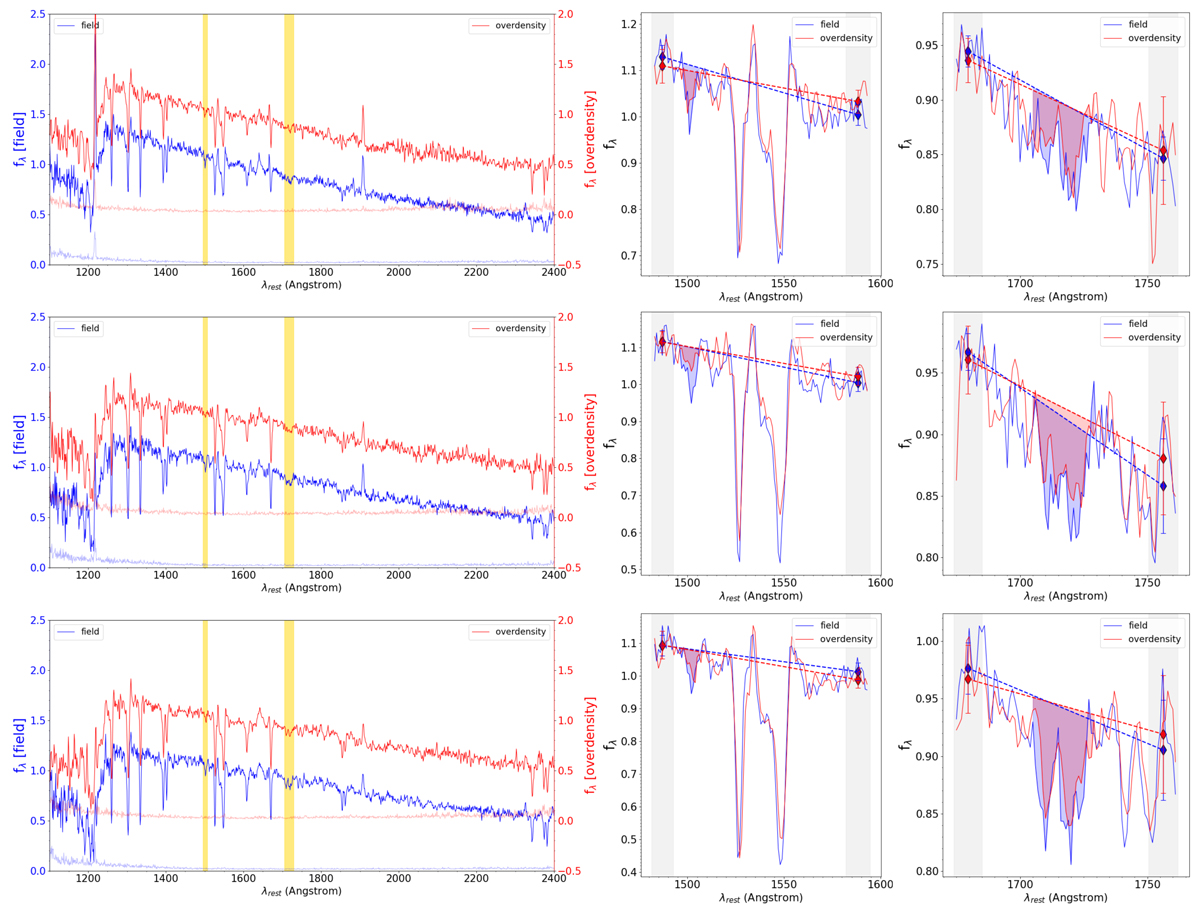
Download original image
Stacked spectra corresponding to the bins in stellar mass and PC-flag20 adopted in panel 4 of Fig. 5. In each row are shown, for each stellar mass bin (increasing mass from top to bottom), the stacks for the galaxy population inside the overdensity structures (in red) and in the field (in blue). For visualization purposes, the two scales of the fluxes and corresponding errors (on the left and right hand y-axis, respectively), have been slightly shifted. The wavelength ranges corresponding to the 1501 and 1719 metallicity indices are highlighted in yellow in the main plot, while they are further magnified in the two panels to the right of each row. Here the features corresponding to the two galaxy populations (protocluster and field) are overplotted to facilitate the comparison. The blueward and redward shaded gray regions correspond to the Rix et al. (2004) windows to define the pseudocontinuum across the absorption feature through a straight line fit, while the shaded red and blue areas are used for the calculation of the equivalent width.
Current usage metrics show cumulative count of Article Views (full-text article views including HTML views, PDF and ePub downloads, according to the available data) and Abstracts Views on Vision4Press platform.
Data correspond to usage on the plateform after 2015. The current usage metrics is available 48-96 hours after online publication and is updated daily on week days.
Initial download of the metrics may take a while.