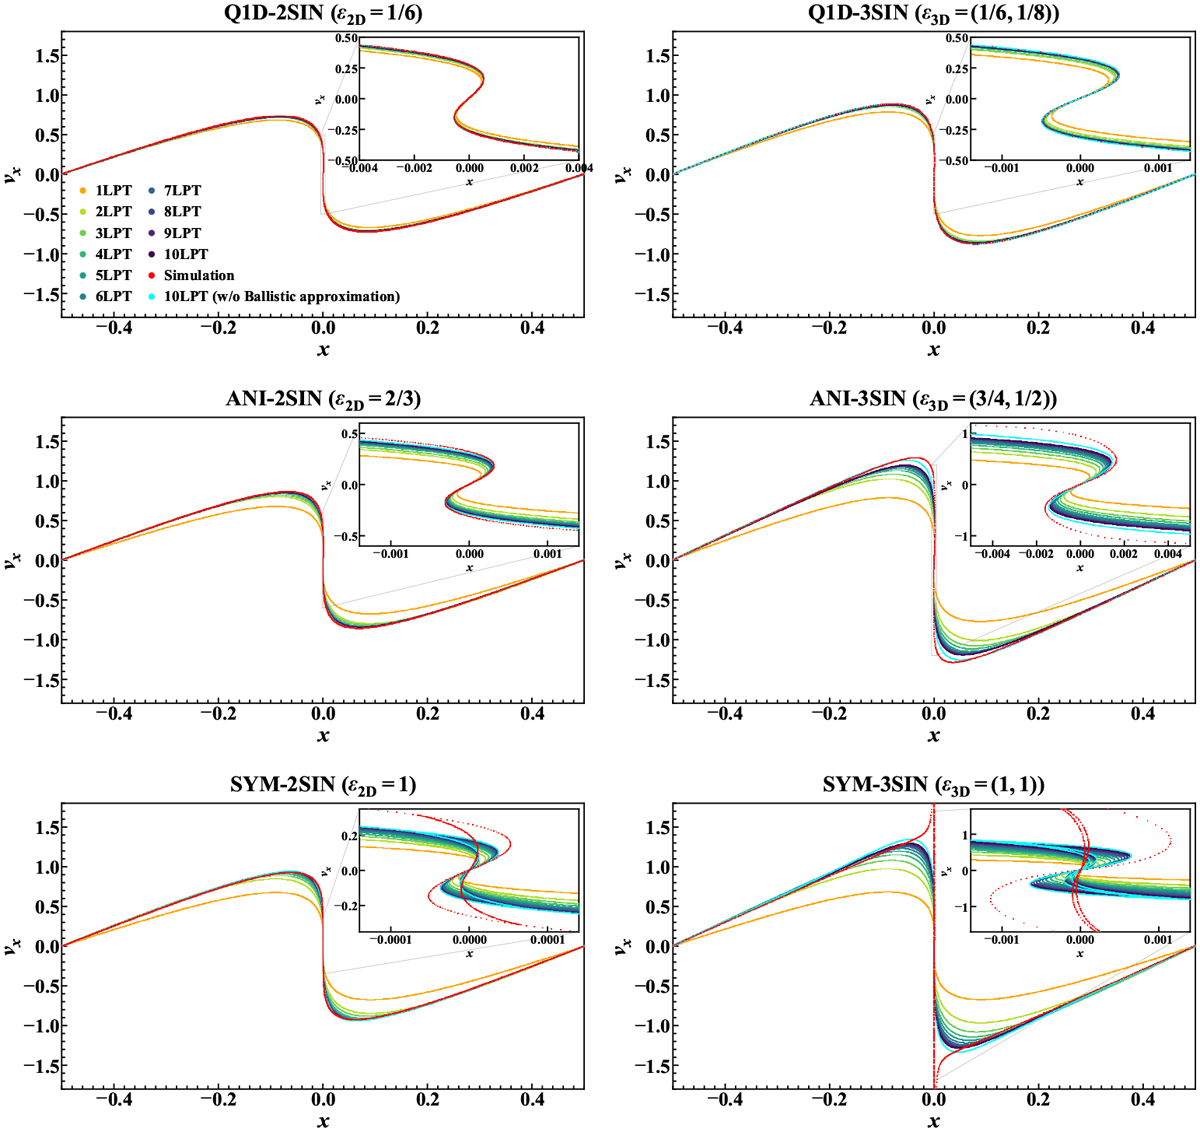
Fig. 10
Download original image
Phase-space structure for two- and three-sine-wave initial conditions shortly after collapse. This figure is analogous to Fig. 2, except that we compare predictions of LPT at various orders in the ballistic approximation framework with measurements in Vlasov simulations shortly after collapse, i.e. for a = asc + Δa, as listed in Table 1 and discussed in the main text. We note that the additional cyan curve corresponds to the LPT prediction at the tenth order without using the ballistic approximation.
Current usage metrics show cumulative count of Article Views (full-text article views including HTML views, PDF and ePub downloads, according to the available data) and Abstracts Views on Vision4Press platform.
Data correspond to usage on the plateform after 2015. The current usage metrics is available 48-96 hours after online publication and is updated daily on week days.
Initial download of the metrics may take a while.