Fig. 10
Download original image
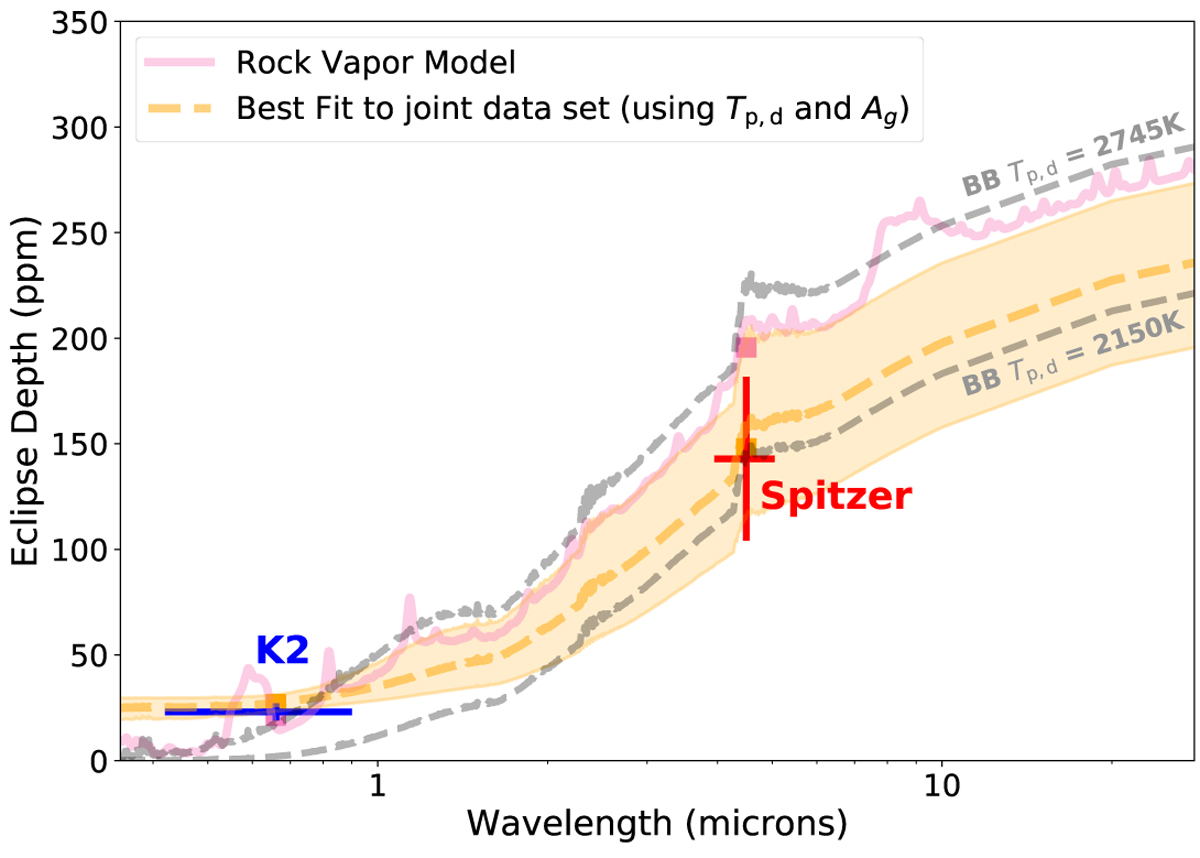
Eclipse depths measured in the Kepler and Spitzer bandpasses compared to different emission spectra of the planet: the pink solid line was calculated using the pseudo-2D rock vapor model and shows thermal emissions in the optical due to Na. The dashed orange line uses the best fit dayside temperature Tp,d and geometric albedo Ag values using the joint dataset (Spitzer & K2). The orange shaded area is due to the uncertainties in Tp,d and Ag. We also show black body (BB) emission spectra in gray for two exemplary dayside temperatures of K2-141 b assuming a geometric albedo of Ag = 0: Tp,d = 2150K that corresponds to a full redistribution of heat on the planet (whole planet is isothermal) and Tp,d = 2745 K in case of instant reradiation of incoming energy (nightside temperature is zero). Any features in the black body spectra are originating from the host star because we divide the black body spectrum of the planet with a Kurucz stellar spectrum (Kurucz 1993). The pink (orange) boxes show the Spitzer and K2 bandpass integrated eclipse depth for the rock vapor model (sum of the thermal and reflective emission from the best fit to the joint data set).
Current usage metrics show cumulative count of Article Views (full-text article views including HTML views, PDF and ePub downloads, according to the available data) and Abstracts Views on Vision4Press platform.
Data correspond to usage on the plateform after 2015. The current usage metrics is available 48-96 hours after online publication and is updated daily on week days.
Initial download of the metrics may take a while.