Fig. 1
Download original image
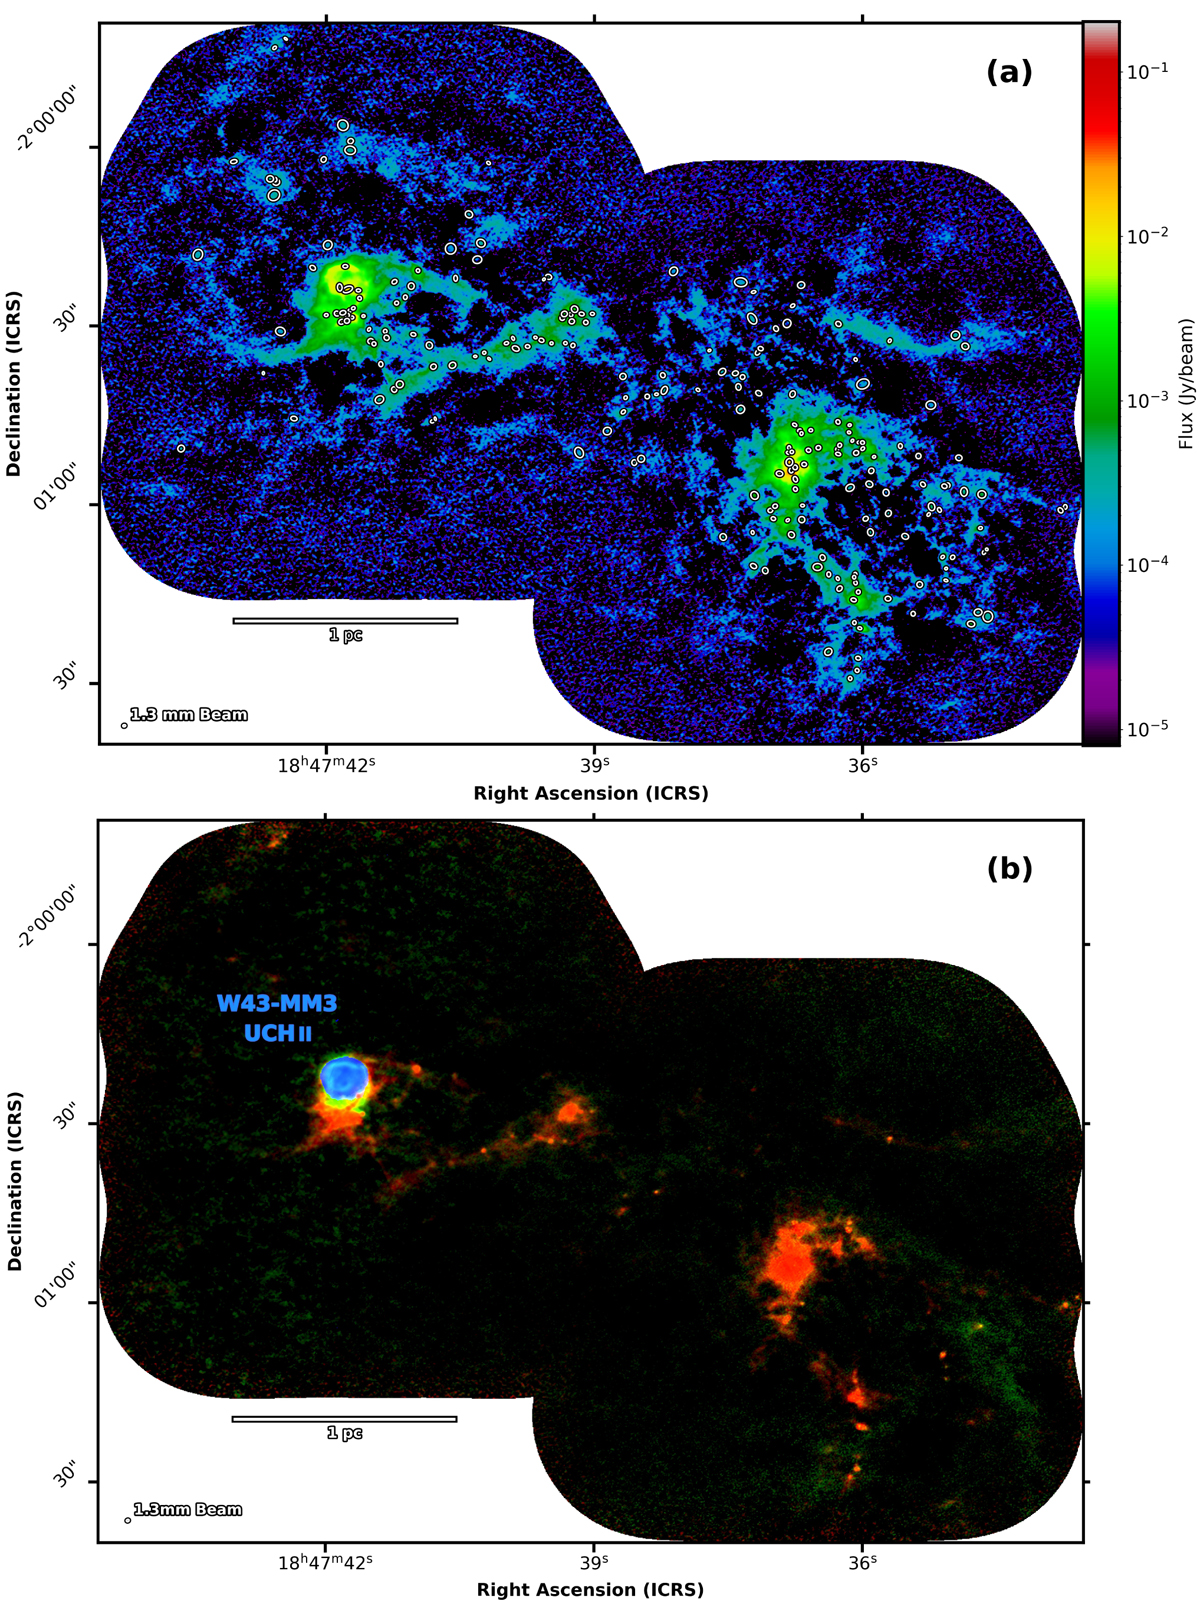
W43-MM2&MM3 protocluster cloud. Panel a: 1.3 mm image obtained by the ALMA 12 m array (best-sensitivity image, prior to primary-beam correction). W43-MM2 is to the west and W43-MM3 is to the east. White ellipses outline the FWHM size of compact cores extracted by getsf. Panel b: three-color ALMA image. Red and green display the bsens continuum images at 1.3 mm and 3 mm, respectively, scaled by the theoretical ratio of thermal dust emission (see Eq. (3)). Blue corresponds to the free-free continuum emission image at the frequency of the H41α recombination line (Galván-Madrid et al., in prep.). Filaments and cores appear in orange (red + green), tracing thermal dust emission; the UCH ii region appears in blue or cyan (blue + green), indicating free-free emission. Ellipses in the lower left corners represent the angular resolution of the bsens 1.3 mm image and scale bars indicate the size in physical units.
Current usage metrics show cumulative count of Article Views (full-text article views including HTML views, PDF and ePub downloads, according to the available data) and Abstracts Views on Vision4Press platform.
Data correspond to usage on the plateform after 2015. The current usage metrics is available 48-96 hours after online publication and is updated daily on week days.
Initial download of the metrics may take a while.