Fig. D.2
Download original image
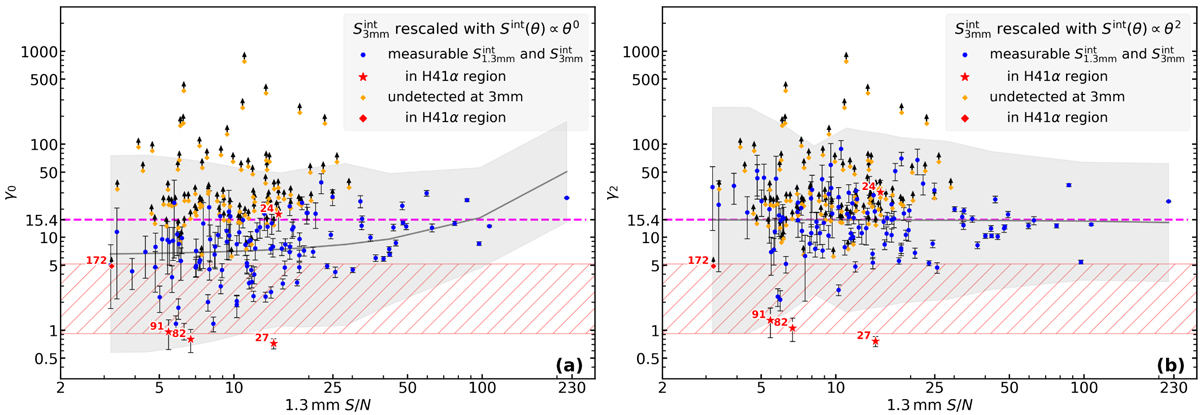
Thermal dust emission cores separated from free-free emission sources, using their 1.3 mm to 3 mm flux ratios without re-scaling, γ0 (in a), and with a stronger re-scaling suited for the flatter density distribution of starless cores, γ2 (in b). Plots are shown as a function of the S/N in the 1.3 mm image. Blue points indicate cores with 3 mm thermal dust emission whose flux is re-scaled to the source size measured at 1.3 mm (see Eq. 1), while orange points locate cores undetected at 3 mm, thus taking the ratio between the 1.3 mm peak flux and the 1 σ peak error at 3 mm, corresponding to a lower limit. Red symbols are sources located within the H41 α recombination line region of Fig. 3a. The gray curve indicates the median value of the core ratios, computed over bins of 20 adjacent cores as ranked by their S/N. The shaded gray area indicates the corresponding 3 σ dispersion in flux ratio values. The magenta horizontal dashed line represents the theoretical flux ratio of thermal dust emission of 15.4, computed in Eq. 3. The red hatched area locates the theoretical flux ratios of UCH ii or HCH ii regions, whose free-free emission is either optically thin (lower limit) or partly to totally optically thick (upper limit). The median value of the blue points is 8.4 ± 2.1 (in a) and 15.3 ± 2.0 (in b).
Current usage metrics show cumulative count of Article Views (full-text article views including HTML views, PDF and ePub downloads, according to the available data) and Abstracts Views on Vision4Press platform.
Data correspond to usage on the plateform after 2015. The current usage metrics is available 48-96 hours after online publication and is updated daily on week days.
Initial download of the metrics may take a while.