Fig. 3
Download original image
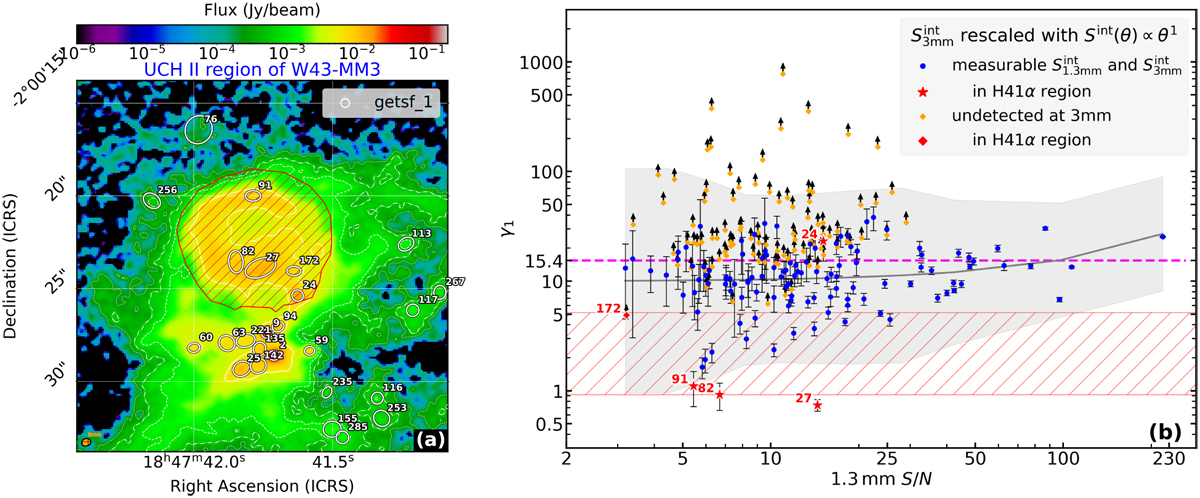
Investigating free-free contaminated sources. Panel a: UCH ii region of W43-MM3 and its surrounding cloud imaged by ALMA at 1.3 mm. The red hatched region outlines the H41α recombination line emission of the H ii region. White ellipses outline source boundaries (at half maximum) as defined by getsf. Panel b: thermal dust emission cores separated from free-free emission sources, using their 1.3 mm to 3 mm flux ratios, γ1, and shown as a function of the ![]() in the 1.3 mm image. Blue points indicate cores with 3 mm thermal dust emission whose flux is rescaled to the source size measured at 1.3 mm (see Eq. (1)), while orange points locate cores undetected at 3 mm, thus taking the ratio of the 1.3 mm peak flux to the 1 σ peak error at 3 mm, corresponding to a lower limit. Red symbols are sources located within the H41α recombination line region displayed in panel a. The gray curve indicates the median value of the core ratios, computed over bins of 20 adjacent cores as ranked by their S/N. The shaded gray area indicates the corresponding 3 σ dispersion in flux ratio values. The magenta horizontal dashed line represents the theoretical flux ratio of thermal dust emission of 15.4, computed in Eq. (3). The red hatched area locates the theoretical flux ratios of UCH ii or HCH ii regions, whose free-free emission is either optically thin (lower limit) or partly to totally optically thick (upper limit).
in the 1.3 mm image. Blue points indicate cores with 3 mm thermal dust emission whose flux is rescaled to the source size measured at 1.3 mm (see Eq. (1)), while orange points locate cores undetected at 3 mm, thus taking the ratio of the 1.3 mm peak flux to the 1 σ peak error at 3 mm, corresponding to a lower limit. Red symbols are sources located within the H41α recombination line region displayed in panel a. The gray curve indicates the median value of the core ratios, computed over bins of 20 adjacent cores as ranked by their S/N. The shaded gray area indicates the corresponding 3 σ dispersion in flux ratio values. The magenta horizontal dashed line represents the theoretical flux ratio of thermal dust emission of 15.4, computed in Eq. (3). The red hatched area locates the theoretical flux ratios of UCH ii or HCH ii regions, whose free-free emission is either optically thin (lower limit) or partly to totally optically thick (upper limit).
Current usage metrics show cumulative count of Article Views (full-text article views including HTML views, PDF and ePub downloads, according to the available data) and Abstracts Views on Vision4Press platform.
Data correspond to usage on the plateform after 2015. The current usage metrics is available 48-96 hours after online publication and is updated daily on week days.
Initial download of the metrics may take a while.