Fig. 8
Download original image
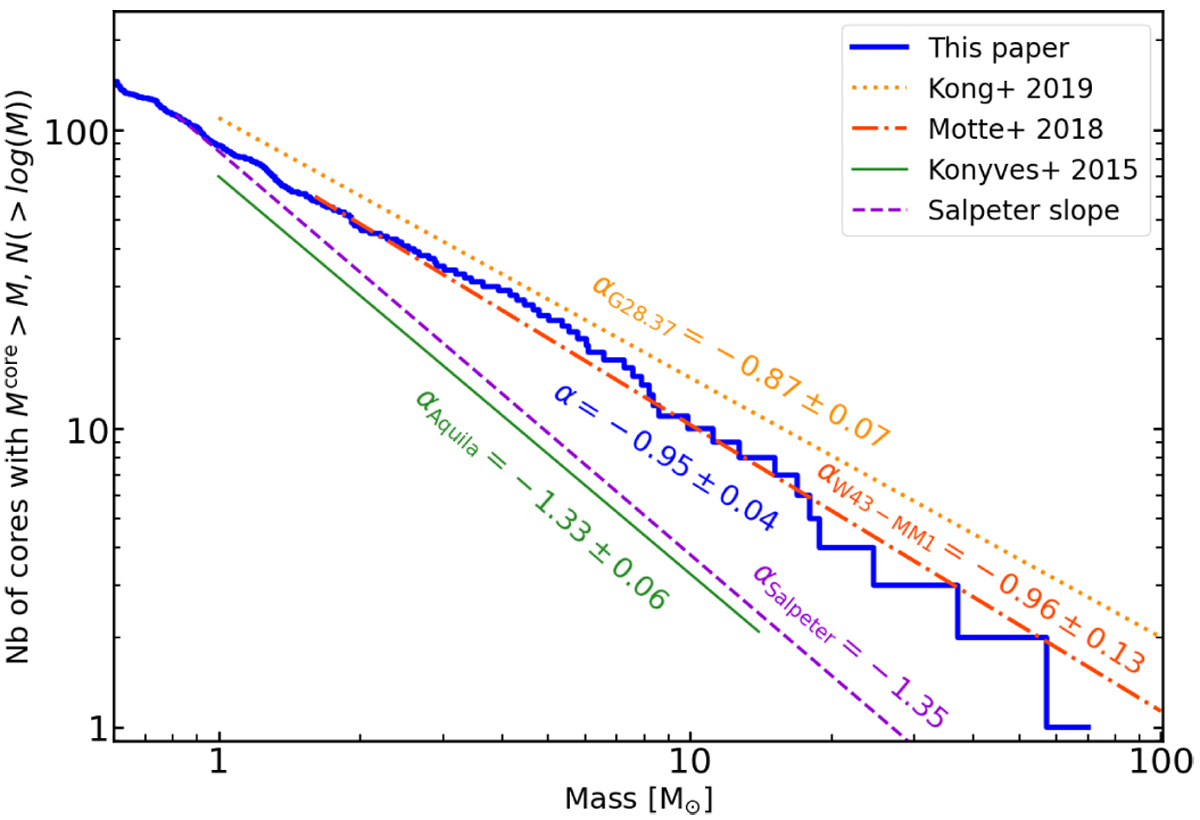
Comparison of the W43-MM2&MM3 CMF (blue histogram, see Fig. 5a) with power-laws fitted to the high-mass end, >1 M⊙, of CMFs measured in three star-forming regions. The proto-typical CMF of low-mass star-forming regions, derived in Aquila (green line, Könyves et al. 2015), resembles the Salpeter slope of the canonical IMF (dashed magenta line, Salpeter 1955). In contrast, the CMFs in W43-MM2&MM3 and in the two high-mass star-forming protoclusters W43-MM1 and G28.37+0.07 (red dot-dashed and orange dotted lines, Motte et al. 2018b; Kong 2019) are top-heavy.
Current usage metrics show cumulative count of Article Views (full-text article views including HTML views, PDF and ePub downloads, according to the available data) and Abstracts Views on Vision4Press platform.
Data correspond to usage on the plateform after 2015. The current usage metrics is available 48-96 hours after online publication and is updated daily on week days.
Initial download of the metrics may take a while.