Fig. 10.
Download original image
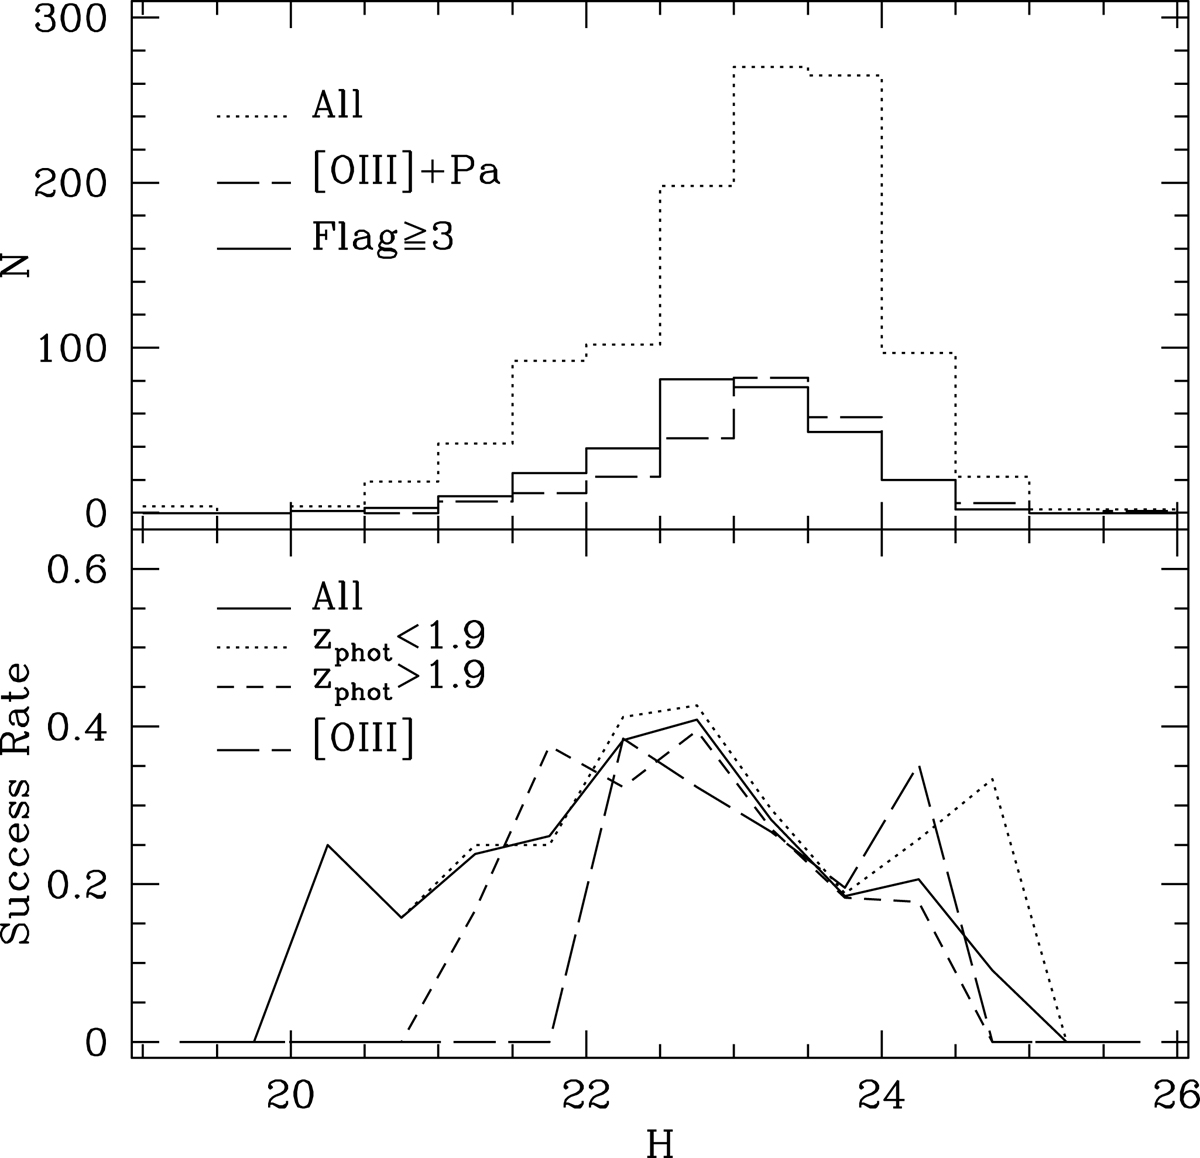
Spectroscopic success rate as a function of magnitude. Top: histogram of the observed H total magnitudes for all observed targets (dotted line), for secondary targets (long-dashed line), and for those with high-quality spectroscopic redshifts (full line). Bottom: success rate as a function of H total magnitudes over the whole probed redshift range (full line), and split according to band (dotted: H band or 1.3 < zphot < 1.7; dashed: K band, or 2 < zphot < 2.7. The long-dashed line shows the success rate targeting the [O III] line.
Current usage metrics show cumulative count of Article Views (full-text article views including HTML views, PDF and ePub downloads, according to the available data) and Abstracts Views on Vision4Press platform.
Data correspond to usage on the plateform after 2015. The current usage metrics is available 48-96 hours after online publication and is updated daily on week days.
Initial download of the metrics may take a while.