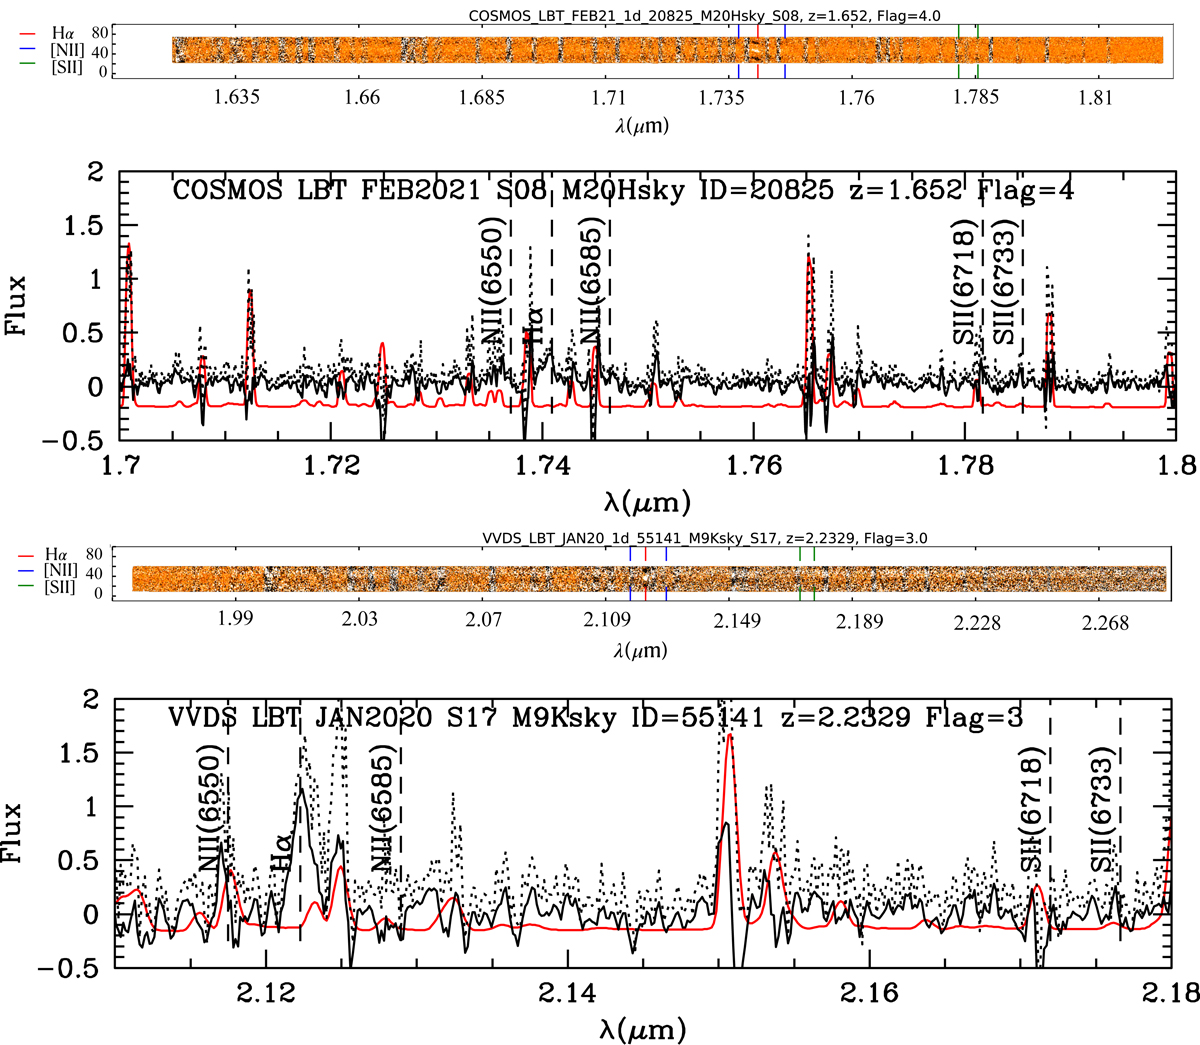
Fig. 3.
Download original image
One- and two-dimensional spectra with Flag = 4, 3.5, 3 of objects with zmeas < 2. The 2D spectra are 10 arcsec in width, with the vertical scale given in pixels, and show the whole wavelength range (in μm) observed. The 1D spectra show the wavelength range around the relevant emission lines; the black solid lines show the measured flux (in arbitrary units with a 3 pixel smoothing), the dotted lines the flux without smoothing plus its errors, the red lines the sky (scaled down by a factor of 1000 and shifted by −0.2 flux units). The vertical dashed lines indicate the emission lines (with vacuum rest-frame wavelengths in Å) used (when visible) to measure the spectroscopic redshift (not yet corrected to the heliocentric system).
Current usage metrics show cumulative count of Article Views (full-text article views including HTML views, PDF and ePub downloads, according to the available data) and Abstracts Views on Vision4Press platform.
Data correspond to usage on the plateform after 2015. The current usage metrics is available 48-96 hours after online publication and is updated daily on week days.
Initial download of the metrics may take a while.