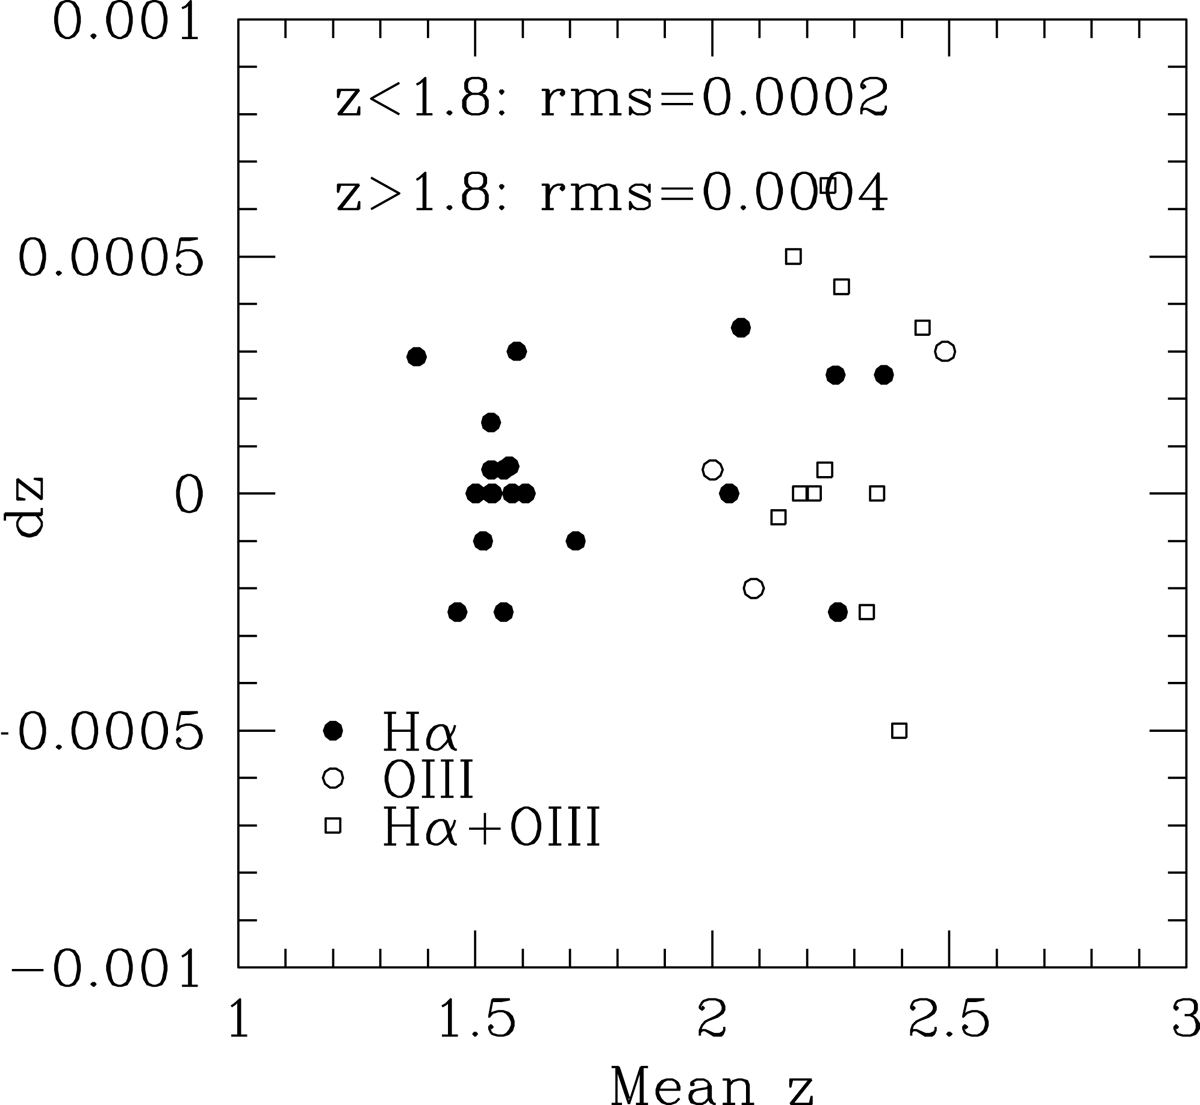
Fig. 5.
Download original image
Errors from repeated observations. The filled circles show the differences dz between the spectroscopic redshifts determined from two or more spectra of the same objects using the Hα line. If more than two spectra were collected, the difference to the average of the measurements is shown. The open circles show differences between redshifts based on the [O III] lines; the open squares show differences between redshifts measured using the Hα and the [O III] lines.
Current usage metrics show cumulative count of Article Views (full-text article views including HTML views, PDF and ePub downloads, according to the available data) and Abstracts Views on Vision4Press platform.
Data correspond to usage on the plateform after 2015. The current usage metrics is available 48-96 hours after online publication and is updated daily on week days.
Initial download of the metrics may take a while.