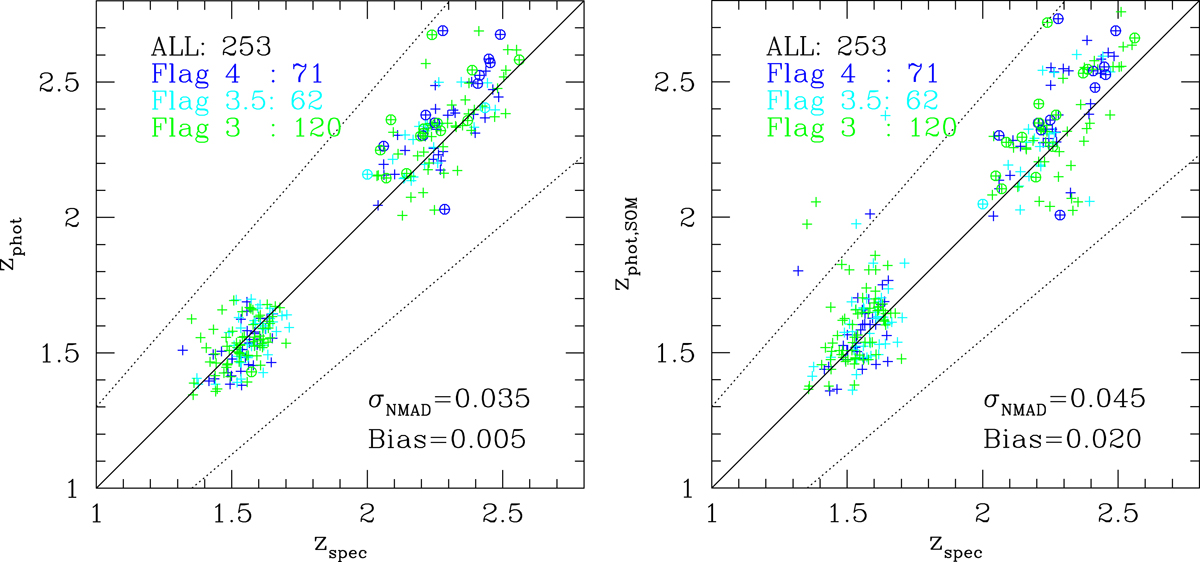
Fig. 6.
Download original image
Comparison between photometric and spectroscopic redshifts. Left: comparison between zphot and zspec for high-quality (Flag ≥ 3) redshift galaxies observed during the LBT campaign. Crosses show spectroscopic redshifts determined from the Hα line, circles with crosses from the [O III] lines. The dotted lines define the region outside which the zphot is considered a catastrophic failure, defined by a redshift error |zphot − zspec|/(1 + zspec)≥0.15. Right: same as the left panel, but comparing zphot, SOM and zspec. The values of σNMAD = 1.48Median(|z − zspec|/(1 + zspec)) and Bias = Mean((z − zspec)/(1 + zspec))) are also given, with z = zphot in the left plot and z = zphot, SOM in the right.
Current usage metrics show cumulative count of Article Views (full-text article views including HTML views, PDF and ePub downloads, according to the available data) and Abstracts Views on Vision4Press platform.
Data correspond to usage on the plateform after 2015. The current usage metrics is available 48-96 hours after online publication and is updated daily on week days.
Initial download of the metrics may take a while.