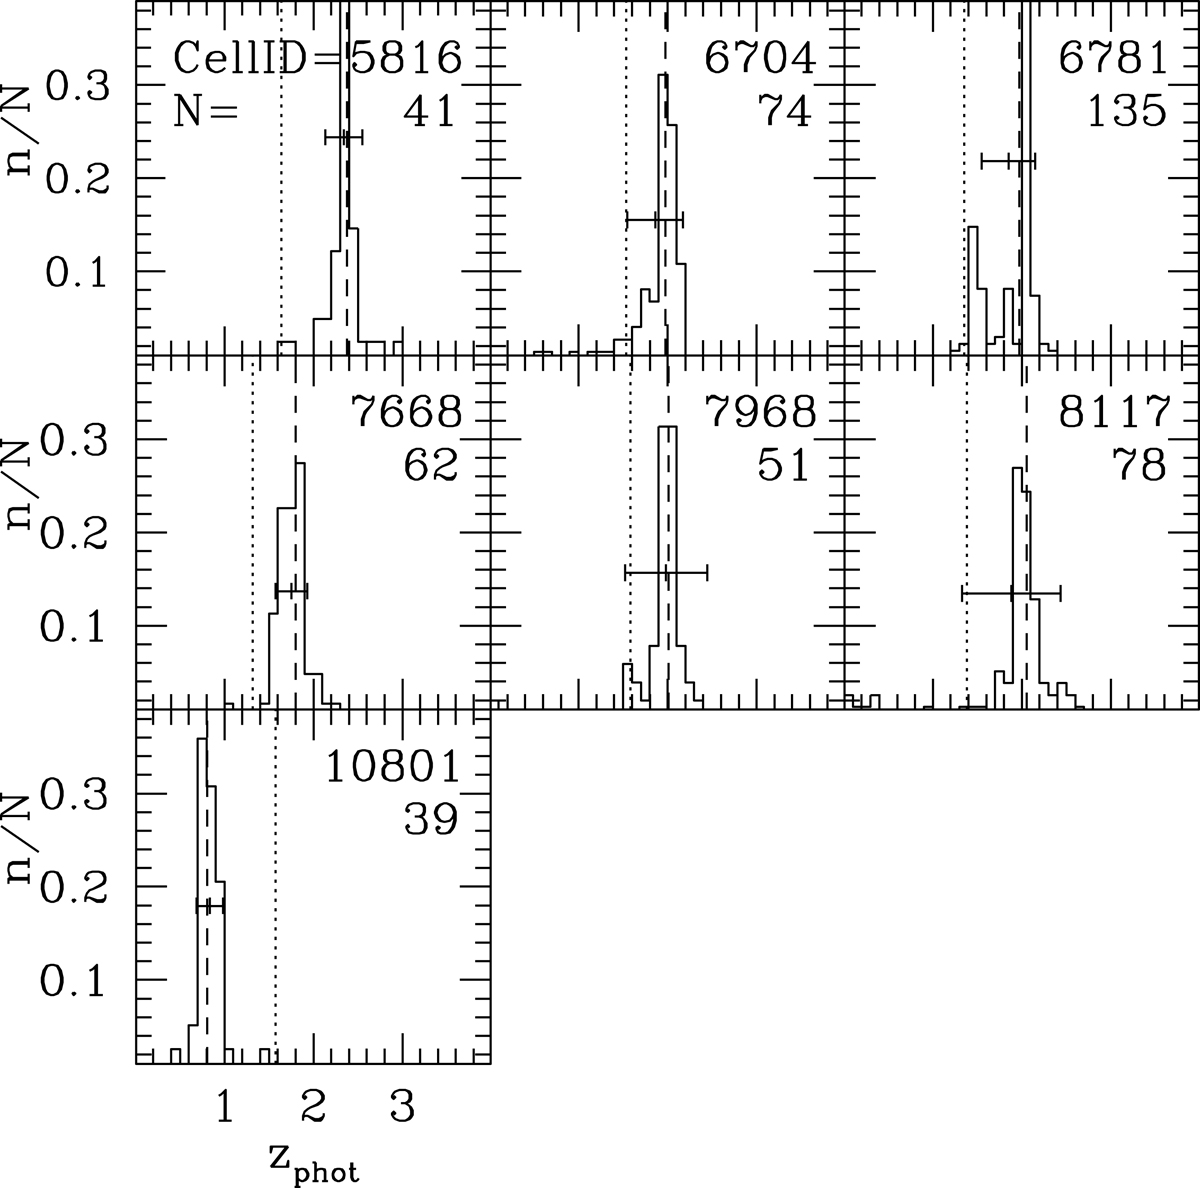
Fig. 8.
Download original image
Histogram of zphot of galaxies populating each cell with |zphot, SOM − zspec|/(1 + zspec) > 0.15 (right panel of Fig. 6). The distribution is normalized by dividing the number of galaxies in each zphot bin by the total number of zphot populating the considered cell; the number is indicated by the letter N in the top left panel, and written in the same position in the others. Similarly, the cell number (CellID) is also given in each panel. The zphot, SOM is represented by the dashed line, whereas dotted lines indicate zspec measured during our program. The horizontal bar centered on the mean zphot is the RMS of the histogram.
Current usage metrics show cumulative count of Article Views (full-text article views including HTML views, PDF and ePub downloads, according to the available data) and Abstracts Views on Vision4Press platform.
Data correspond to usage on the plateform after 2015. The current usage metrics is available 48-96 hours after online publication and is updated daily on week days.
Initial download of the metrics may take a while.