Fig. 1.
Download original image
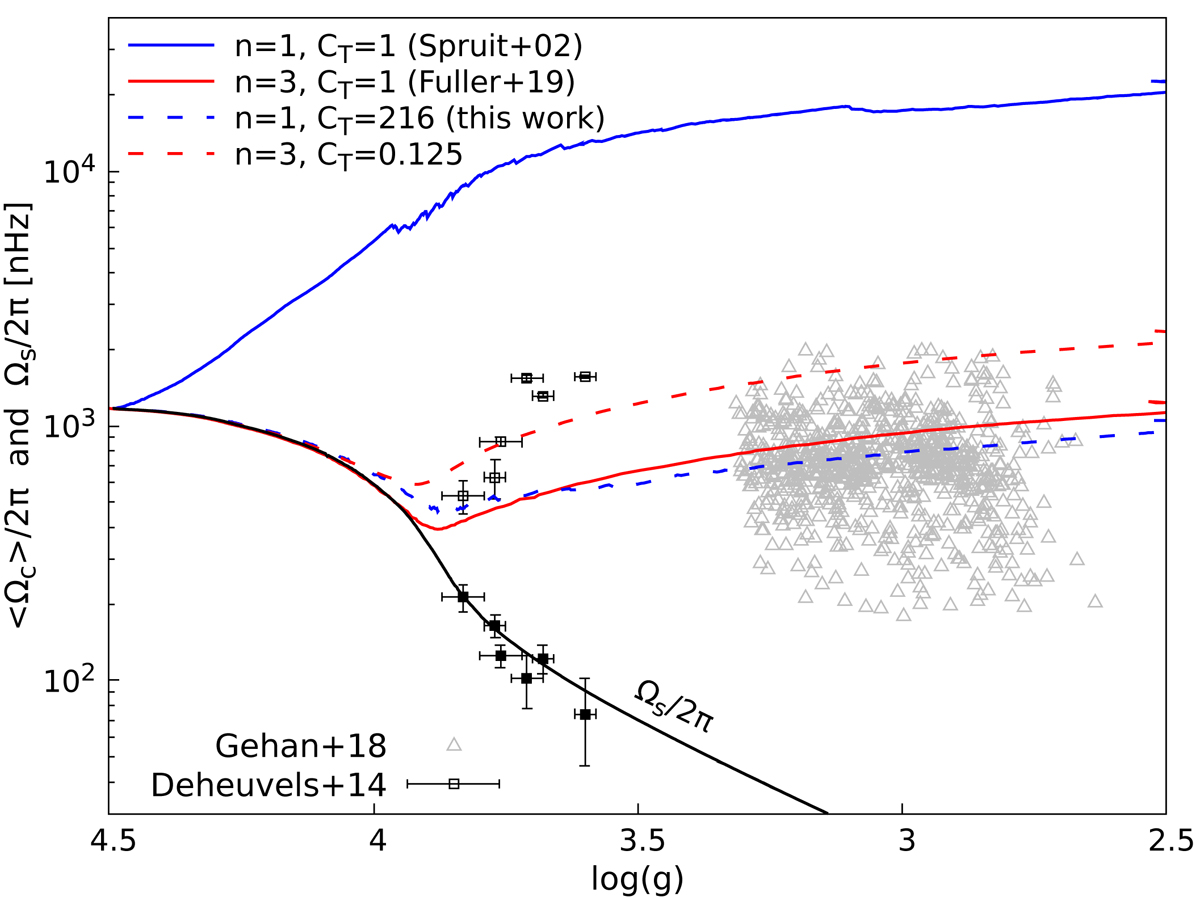
Core rotation rates as a function of surface gravity for 1.1 M⊙ models computed with the general equations (Eqs. (8) and (12)) for AM transport by the Tayler instability with different values of n and the calibration constant CT. The blue and red lines correspond to n = 1 and n = 3, respectively. Solid blue and red lines indicate models with CT = 1. Dashed blue and red lines correspond to CT = 216 and CT = 0.125, respectively. The solid black line indicates the evolution of the surface rotation rate.
Current usage metrics show cumulative count of Article Views (full-text article views including HTML views, PDF and ePub downloads, according to the available data) and Abstracts Views on Vision4Press platform.
Data correspond to usage on the plateform after 2015. The current usage metrics is available 48-96 hours after online publication and is updated daily on week days.
Initial download of the metrics may take a while.