Open Access
Fig. 2.
Download original image
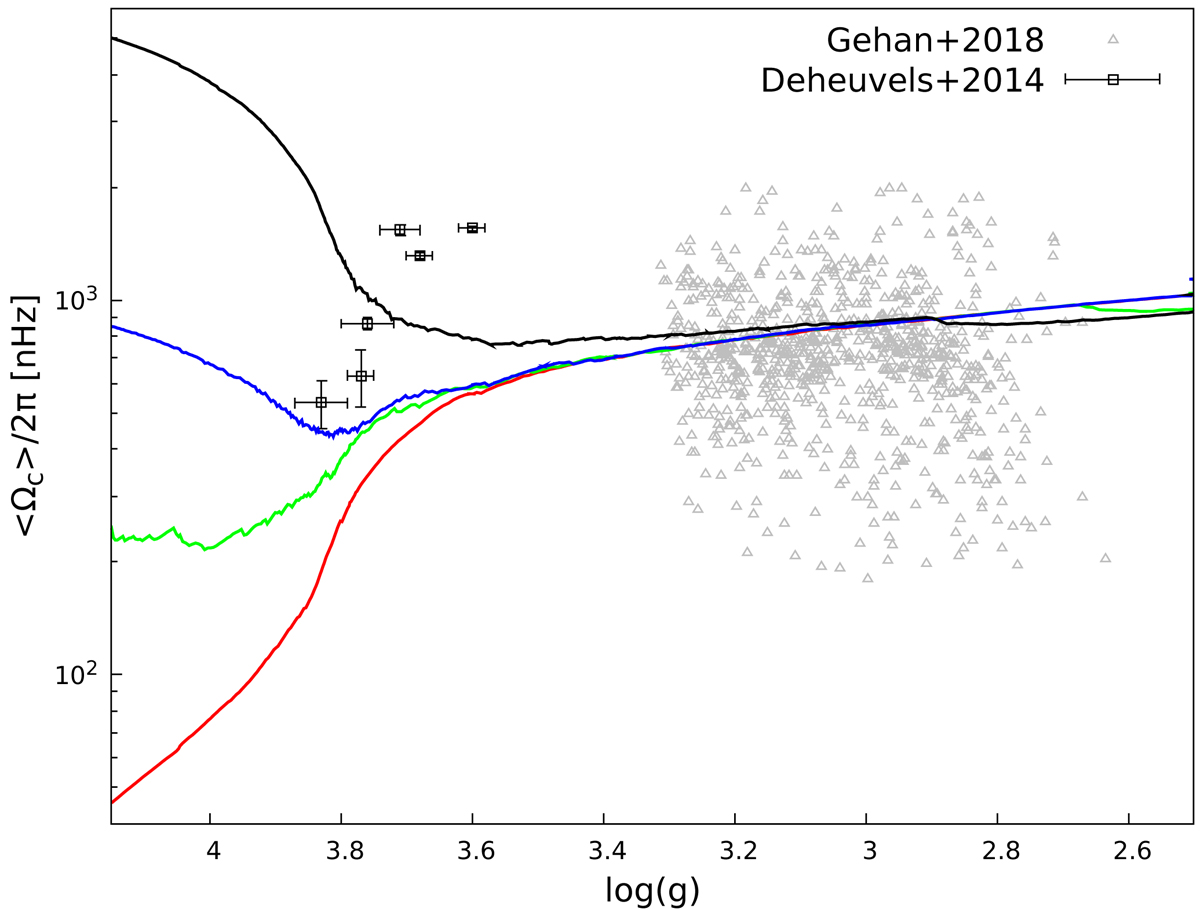
Core rotation rates as a function of surface gravity for 1.2 M⊙ models with n = 1 and CT = 216 computed for different initial rotation velocities. Red, green, blue, and black lines indicate the core rotation rates for models with a surface rotation period of about 3300, 300, 60, and 12 days at log g ∼ 3.8, respectively.
Current usage metrics show cumulative count of Article Views (full-text article views including HTML views, PDF and ePub downloads, according to the available data) and Abstracts Views on Vision4Press platform.
Data correspond to usage on the plateform after 2015. The current usage metrics is available 48-96 hours after online publication and is updated daily on week days.
Initial download of the metrics may take a while.