Fig. 1
Download original image
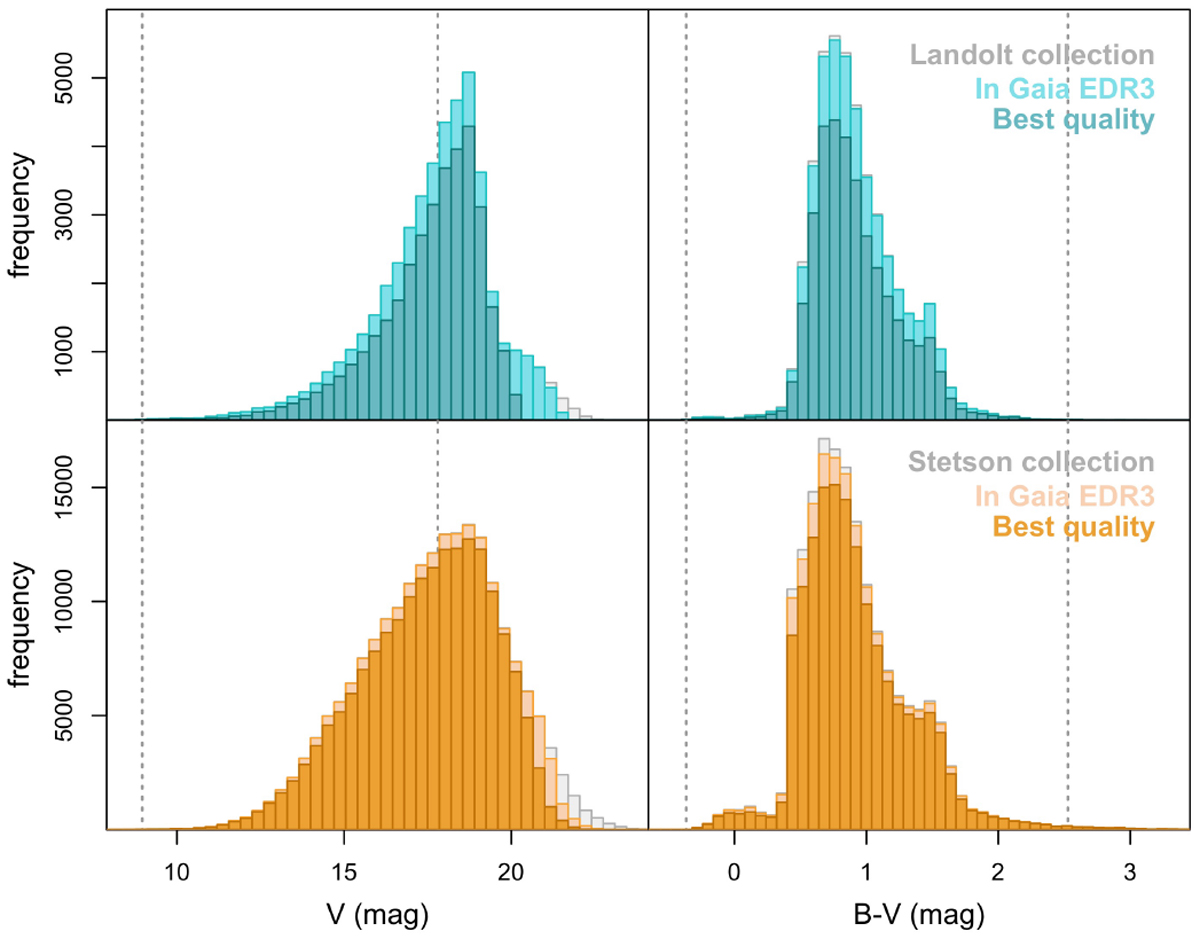
The V magnitude (left panels) and B–V color (right panels) distribution of the Landolt (top panels) and Stetson (bottom panels) collections. The full samples are plotted in grey, the samples with a match in Gaia EDR3 in light colors, and the best-quality samples (see Sect. 4.1 for details) in full colors. The dotted vertical lines show the coverage of the original Landolt (1992) standards set.
Current usage metrics show cumulative count of Article Views (full-text article views including HTML views, PDF and ePub downloads, according to the available data) and Abstracts Views on Vision4Press platform.
Data correspond to usage on the plateform after 2015. The current usage metrics is available 48-96 hours after online publication and is updated daily on week days.
Initial download of the metrics may take a while.