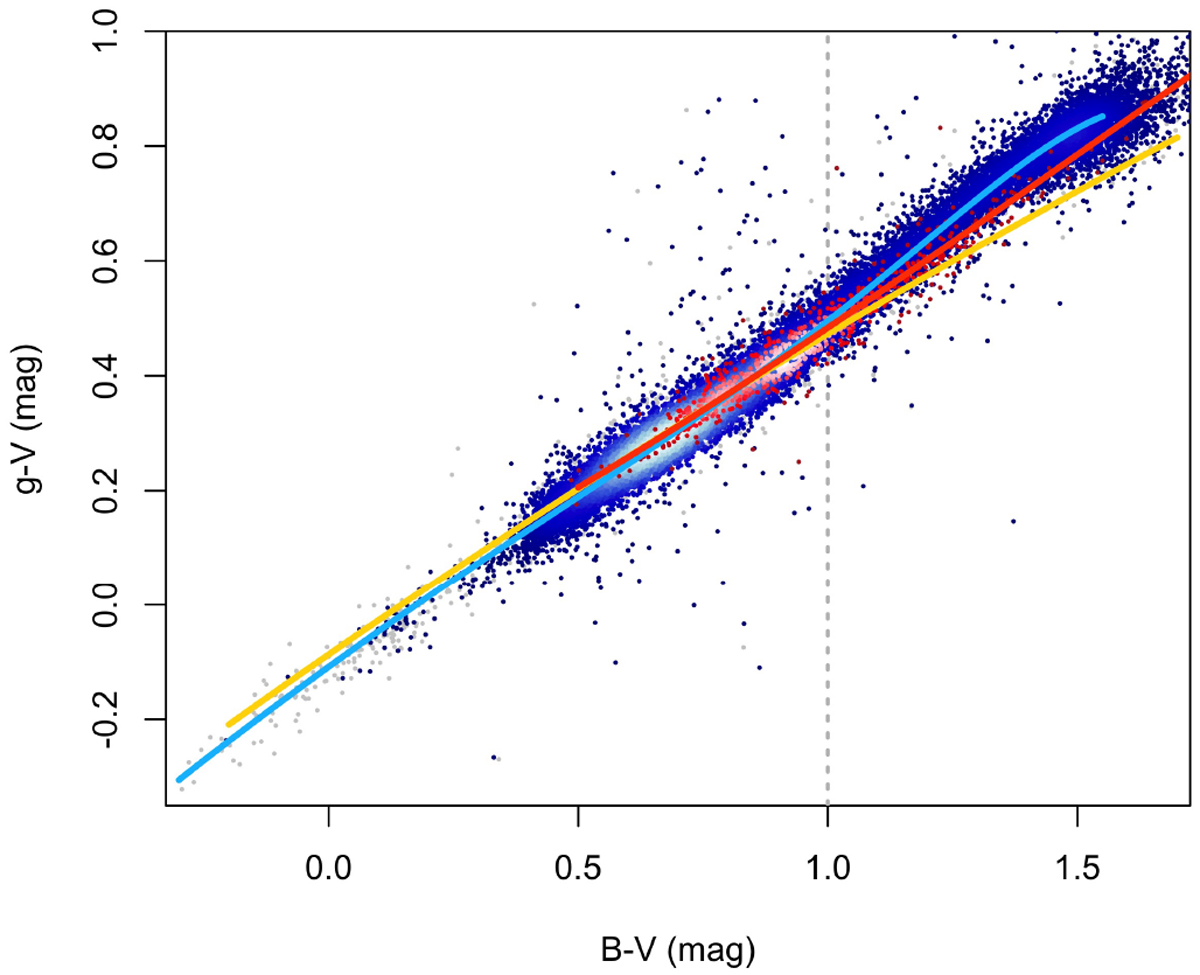
Fig. 12
Download original image
Similar to Fig. 11, but for the SDSS DR13 ugriz system. In particular, the B–V, g–V case is shown. The clean sample is plotted in the background as grey dots, dwarfs are plotted in blue, and giants in red. The polynomials fitted on the two samples separately are plotted as a light blue and an orange line, respectively. The original transformation by Rodgers et al. (2006), who used the Smith et al. (2002) ugriz standards and who could only count on four stars redder than B–V = 1 mag (grey dotted line), is shown in yellow. For B–V < 1 mag, the three relations agree within about 2%. In general, the Rodgers et al. (2006) relation agrees more with the giants sample than with the dwarfs one.
Current usage metrics show cumulative count of Article Views (full-text article views including HTML views, PDF and ePub downloads, according to the available data) and Abstracts Views on Vision4Press platform.
Data correspond to usage on the plateform after 2015. The current usage metrics is available 48-96 hours after online publication and is updated daily on week days.
Initial download of the metrics may take a while.