Fig. 3
Download original image
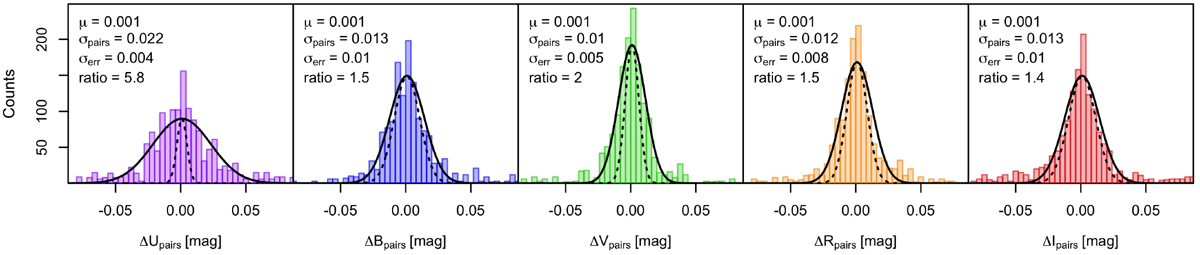
Analysis of the 1532 duplicated measurements in the Landolt collection, for 679 stars. Each panel displays the paired magnitude differences in a different band. Solid lines are Gaussians centered on the mean difference µ and standard deviation equal to the MAD (median absolute deviation) of the paired differences σpairs. Dashed lines show Gaussians centered on µ and with a standard deviation obtained by summing in quadrature the Landolt uncertainties of the stars in each pair, σerr. The ratios between the two standard deviations are annotated in each panel, along with relevant quantities.
Current usage metrics show cumulative count of Article Views (full-text article views including HTML views, PDF and ePub downloads, according to the available data) and Abstracts Views on Vision4Press platform.
Data correspond to usage on the plateform after 2015. The current usage metrics is available 48-96 hours after online publication and is updated daily on week days.
Initial download of the metrics may take a while.