Fig. 5
Download original image
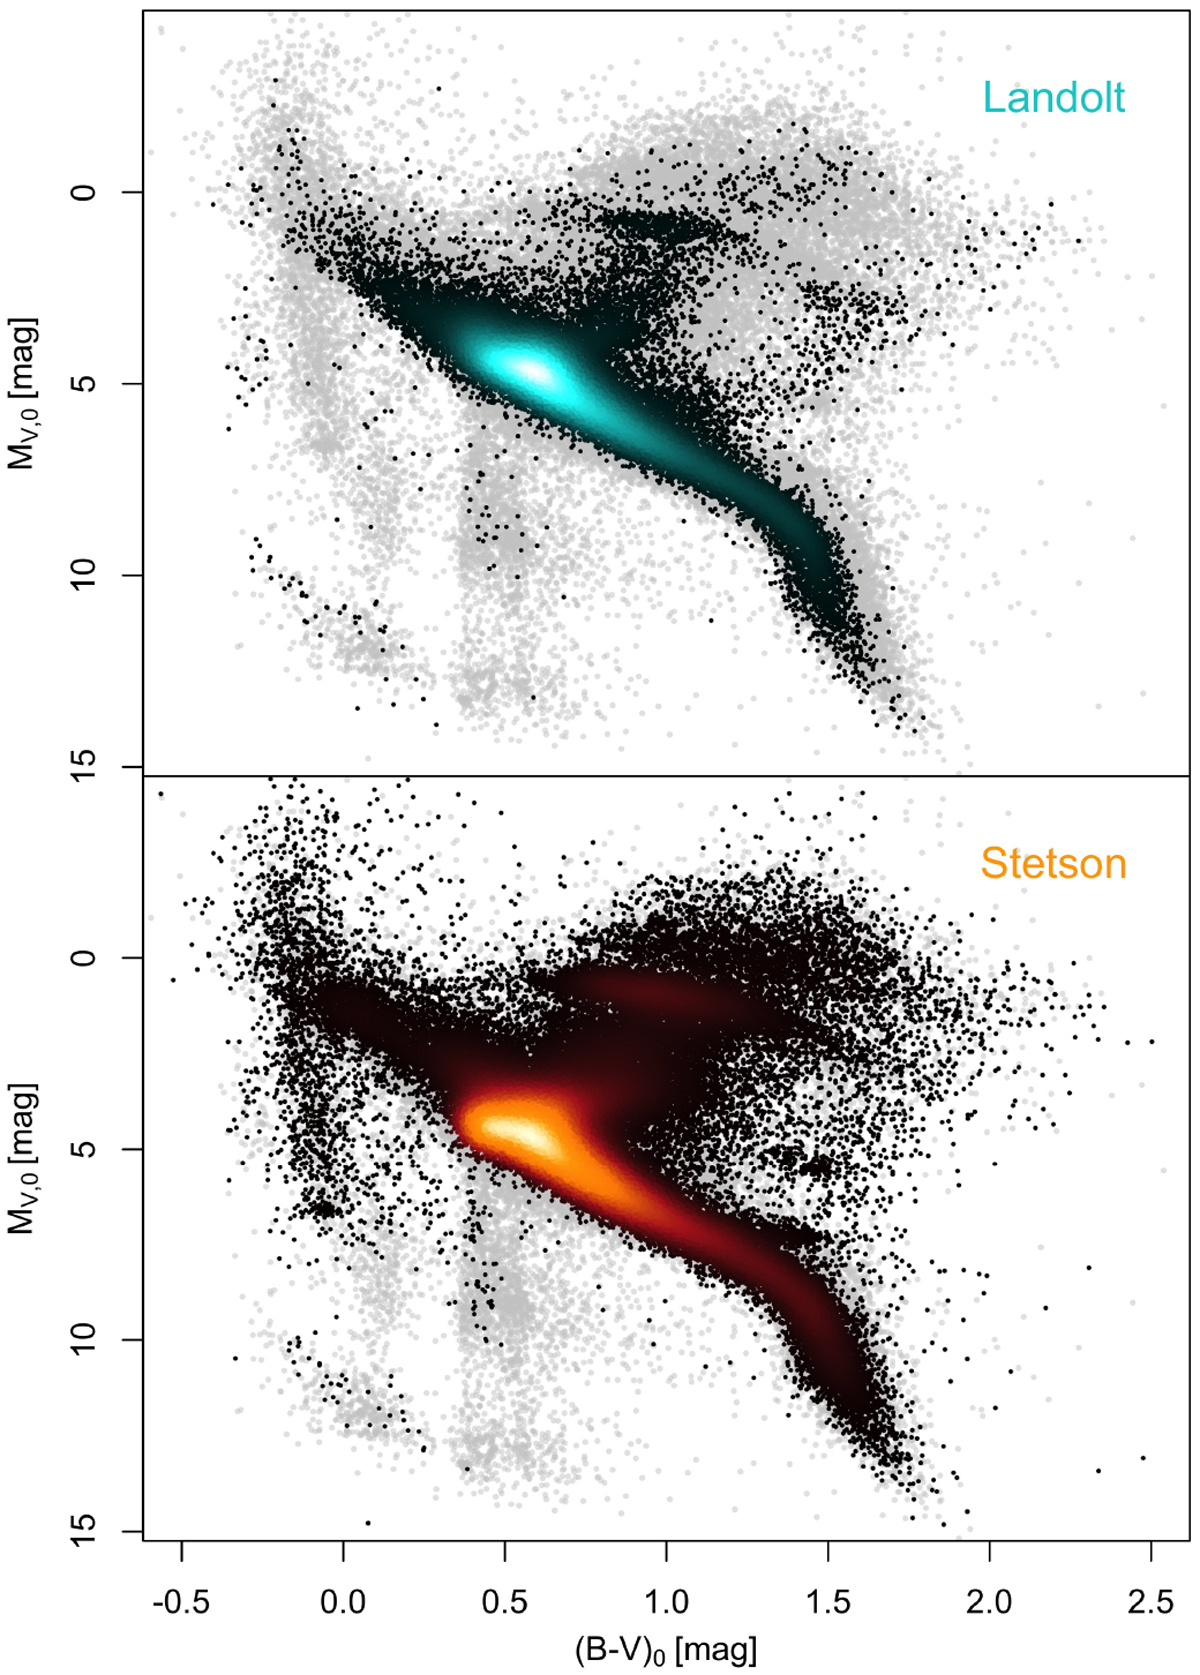
The clean Landolt (top panel) and Stetson (bottom panel) samples, in the absolute and de-reddened V, B–V plane. Stars belonging to both the Landolt and the Stetson collections are only shown in the top panel. The color scales reflect the density of points in the CMD. The whole sample of stars with distance and reddening estimates (Sect. 4.3, Table 3) is reported in both panels as grey dots in the background. The vertical stripes of stars between the main sequence and the white dwarfs, that almost disappear in the clean samples, are mostly made of relatively faint stars with very uncertain distance estimates.
Current usage metrics show cumulative count of Article Views (full-text article views including HTML views, PDF and ePub downloads, according to the available data) and Abstracts Views on Vision4Press platform.
Data correspond to usage on the plateform after 2015. The current usage metrics is available 48-96 hours after online publication and is updated daily on week days.
Initial download of the metrics may take a while.