Fig. 9
Download original image
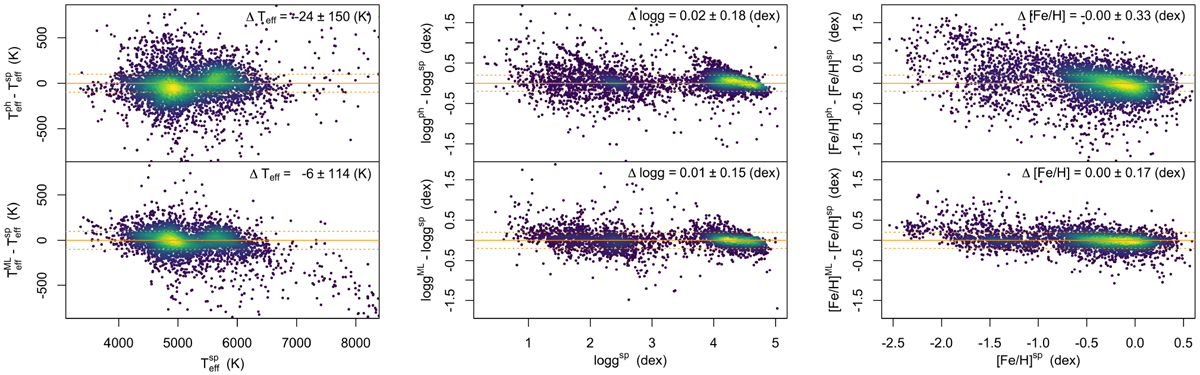
Comparison between parameters obtained with different methods. Top panels: differences between the photometric and spectroscopic parameters. Bottom panels: differences between the machine-learning and the spectroscopic parameters. Left panels: case of Teff, the middle ones of logg, and the right ones of [Fe/H]. The median difference and MAD are written in each panel. The horizontal lines mark the zero (perfect agreement), ±100 K (for Teff), and ±0.2 dex differences (for logg and [Fe/H]), respectively. See Sect. 4.5 for more details.
Current usage metrics show cumulative count of Article Views (full-text article views including HTML views, PDF and ePub downloads, according to the available data) and Abstracts Views on Vision4Press platform.
Data correspond to usage on the plateform after 2015. The current usage metrics is available 48-96 hours after online publication and is updated daily on week days.
Initial download of the metrics may take a while.