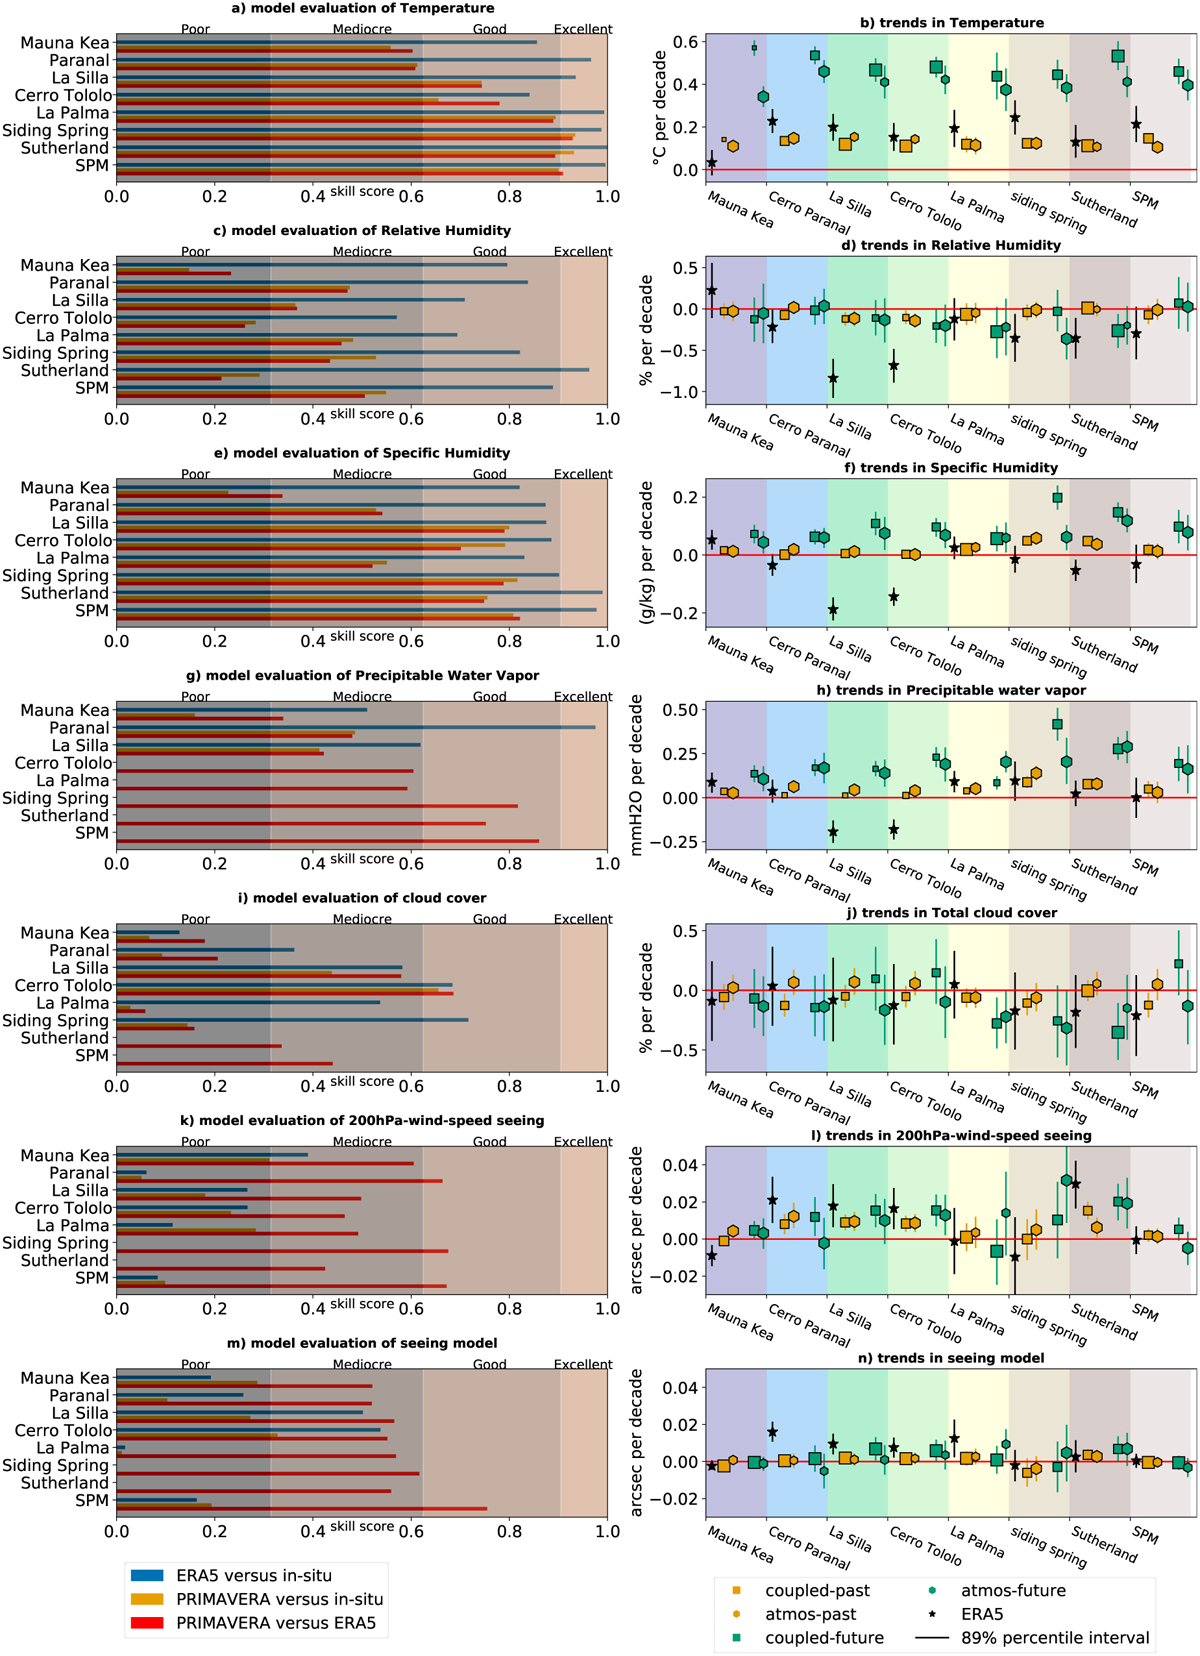
Fig. 11
Download original image
Skill scores (left) and trends (right) for all sites and all variables: temperature (a, b), relative humidity (c, d), specific humidity (e, f), PWV (g, h), total cloud cover (i, j), 200 hPa wind-speed seeing (k, l) and seeing model (m, n). Skill scores (Sect. 5.2.5) are shown with their classification (Table 5) for the time-intersecting ERA5 versus in situ (blue), time-intersecting PRIMAVERA versus in situ (dark-yellow) and PRIMAVERA versus ERA5 (1979−2014, red). Trends (in units per decade) are shown for ERA5 (1979−2019, black stars), PRIMAVERA historical (1950−2014, dark-yellow markers) and PRIMAVERA future simulations (2015−2050, green markers). Coupled and atmosphere-only simulations are shown with squares and diamonds, respectively. The larger the markers, the higher the skill scores. The error bars show the 89th percentile credible interval of the Bayesian analysis (Sect. 5.3). The horizontal red line marks the zero line (with no trend). The data used to produce this figure can be found in Tables A.1−A.14.
Current usage metrics show cumulative count of Article Views (full-text article views including HTML views, PDF and ePub downloads, according to the available data) and Abstracts Views on Vision4Press platform.
Data correspond to usage on the plateform after 2015. The current usage metrics is available 48-96 hours after online publication and is updated daily on week days.
Initial download of the metrics may take a while.