Fig. 2
Download original image
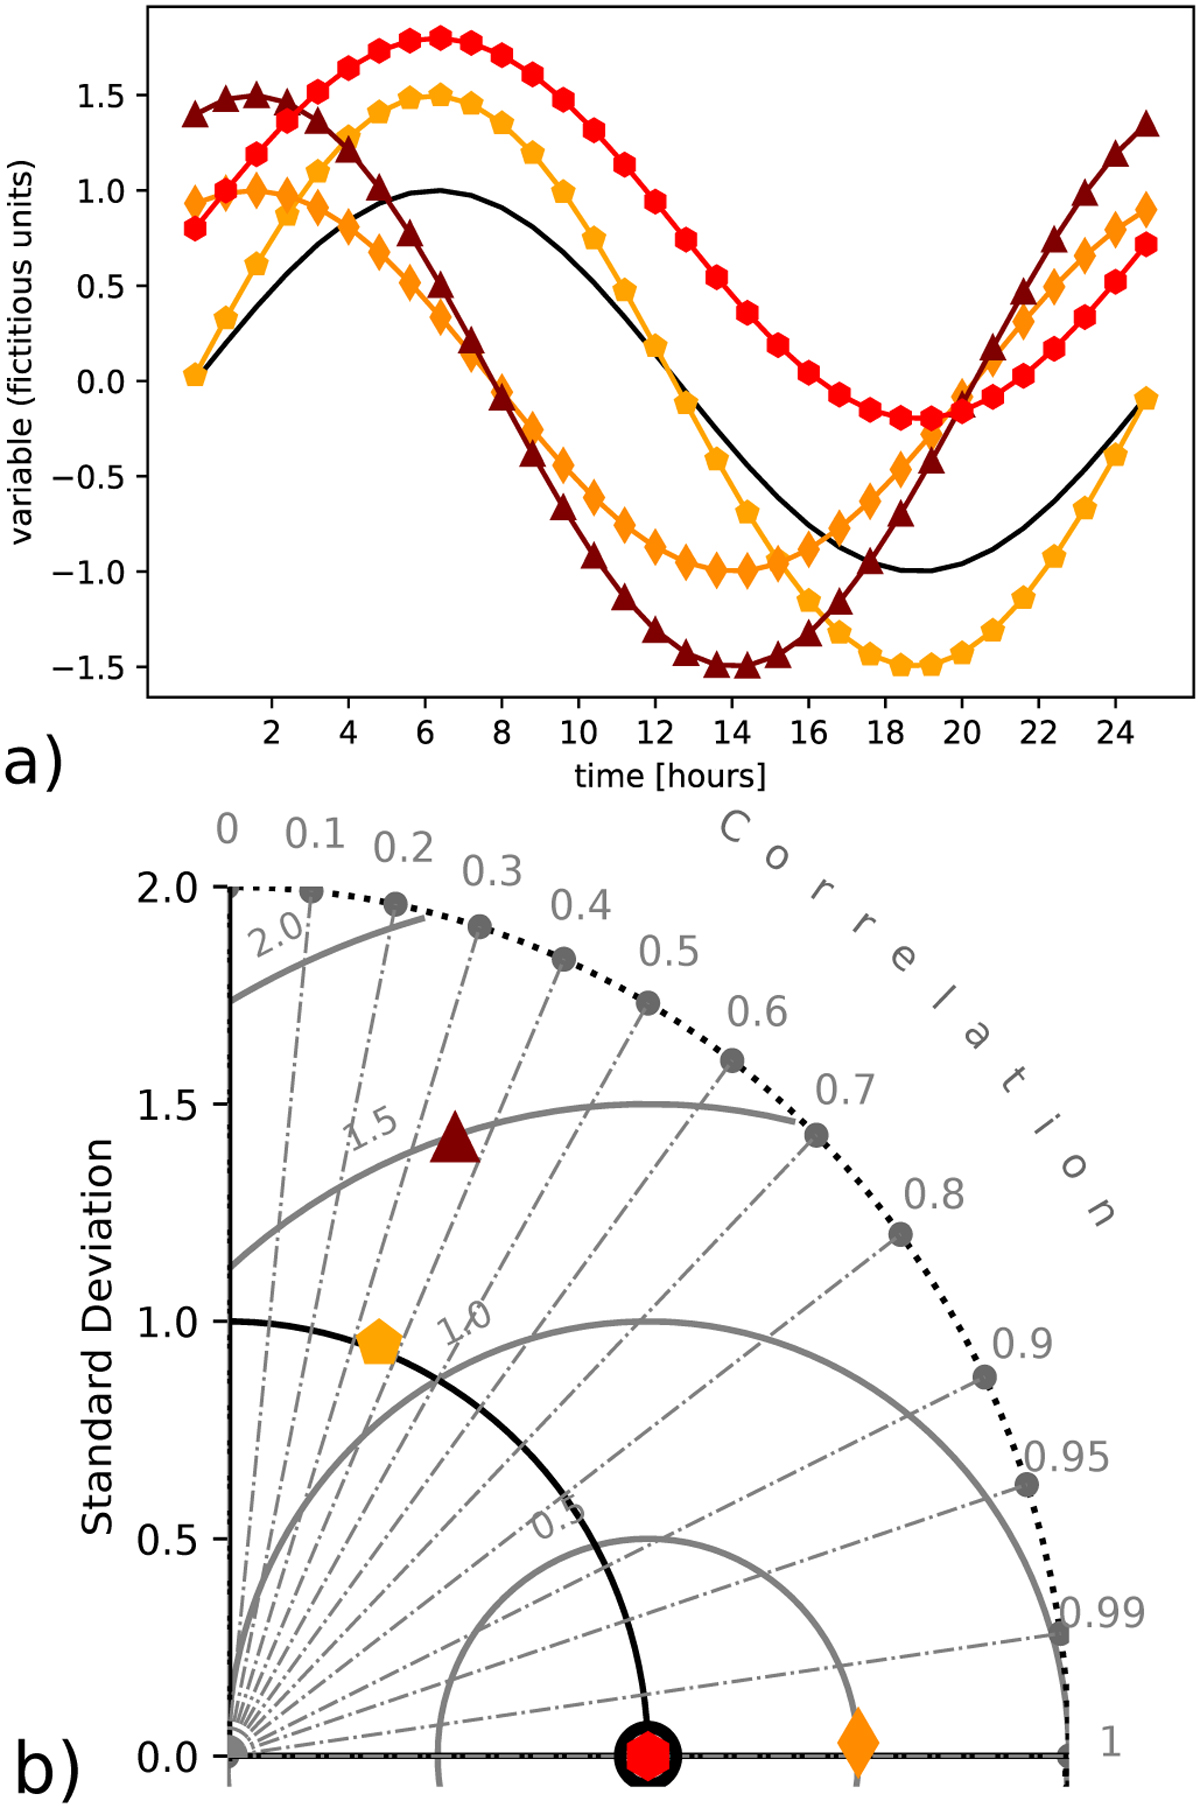
Example of model performance assessment. (a) Fictitious diurnal cycle with (b) corresponding Taylor diagram. The solid black line in (a) represents the ground truth observation, whereas the solid coloured lines in (a) represent the test data. One test dataset shows an offset (or bias) from the ground truth (filled red hexagons), one overestimates the amplitude of me diurnal cycle (filled orange pentagons), one demonstrates a delay in phase (filled dark-orange diamonds) and one that includes both biases (filled maroon triangles. In the Taylor diagram in (b), the black circle on the x-axis represents the ground truth observation. The displayed sine-functions are all made up of y = a · sin(x + b) + c with parameters a, b and c as follows: black solid: a = 0, b = 0, c = 0 hexagon (red): a = 0, b = 0, c = 0.8 pentagon (orange): a = 1.5, b = 0, c = 0 diamond (dark-orange): a = 0, b = 1.2, c = 0 up-triangle (maroon): a = 1.5, b = 1.2, c = 0.
Current usage metrics show cumulative count of Article Views (full-text article views including HTML views, PDF and ePub downloads, according to the available data) and Abstracts Views on Vision4Press platform.
Data correspond to usage on the plateform after 2015. The current usage metrics is available 48-96 hours after online publication and is updated daily on week days.
Initial download of the metrics may take a while.