Fig. 1.
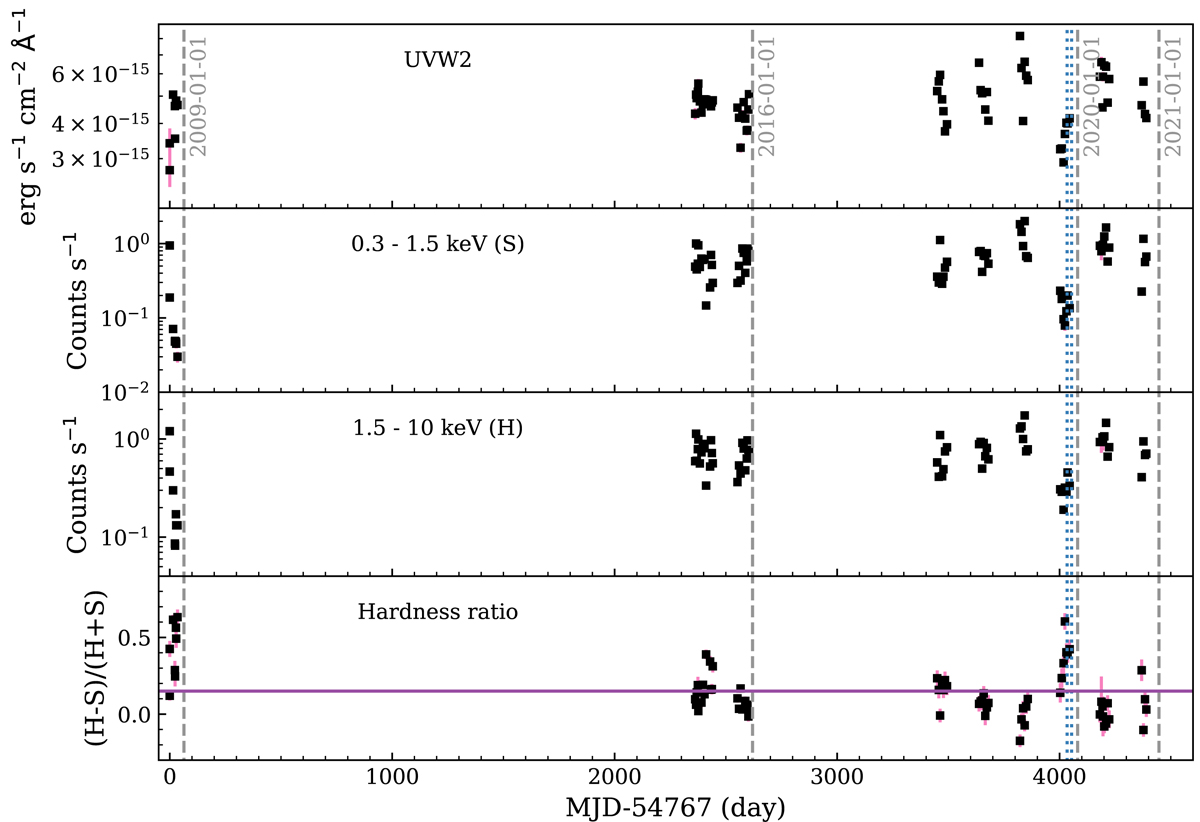
Download original image
Archival Swift data for NGC 3227 from 2008-10-28 to 2020-12-27. The top panel is the UVW2 flux. The two middle panels are the count rates in the hard (H: 1.5 − 10 keV) and soft (S: 0.3 − 1.5 keV) X-ray bands. Statistical uncertainties are in general too small to be visible in the plot. The bottom panel shows the X-ray hardness ratio (H − S)/(H + S). The horizontal solid line in purple is the historical average hardness ratio before late 2020. Calendar dates are marked by the vertical dashed lines. The vertical dotted lines in blue mark the joint HST/COS, XMM-Newton, and NuSTAR observations in late 2019.
Current usage metrics show cumulative count of Article Views (full-text article views including HTML views, PDF and ePub downloads, according to the available data) and Abstracts Views on Vision4Press platform.
Data correspond to usage on the plateform after 2015. The current usage metrics is available 48-96 hours after online publication and is updated daily on week days.
Initial download of the metrics may take a while.