Fig. 1.
Download original image
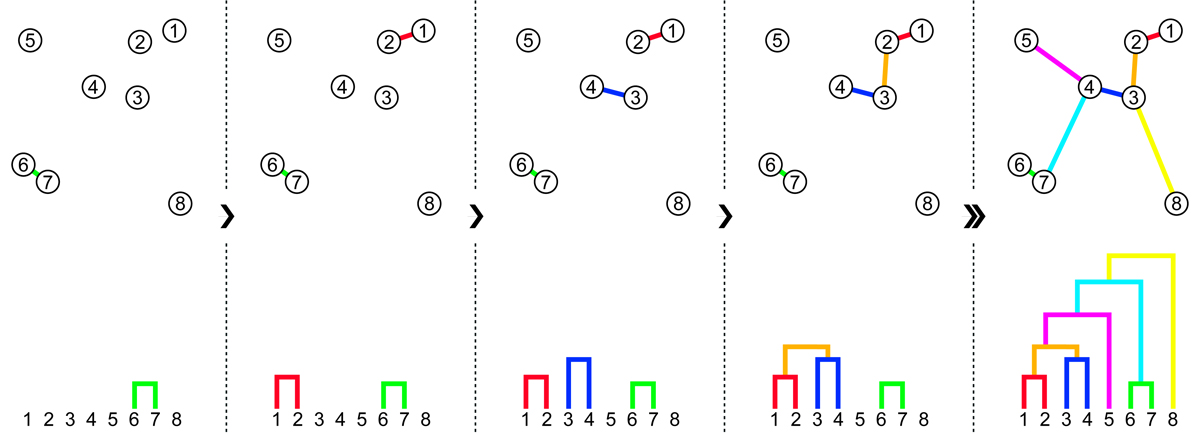
Single linkage algorithm applied on a two-dimensional example. Each step of the algorithm forms a new group by connecting the two closest data points not yet in the same cluster, where each data point is considered a singleton group initially. The resulting merging hierarchy is visualised as a dendrogram at the bottom of each panel.
Current usage metrics show cumulative count of Article Views (full-text article views including HTML views, PDF and ePub downloads, according to the available data) and Abstracts Views on Vision4Press platform.
Data correspond to usage on the plateform after 2015. The current usage metrics is available 48-96 hours after online publication and is updated daily on week days.
Initial download of the metrics may take a while.