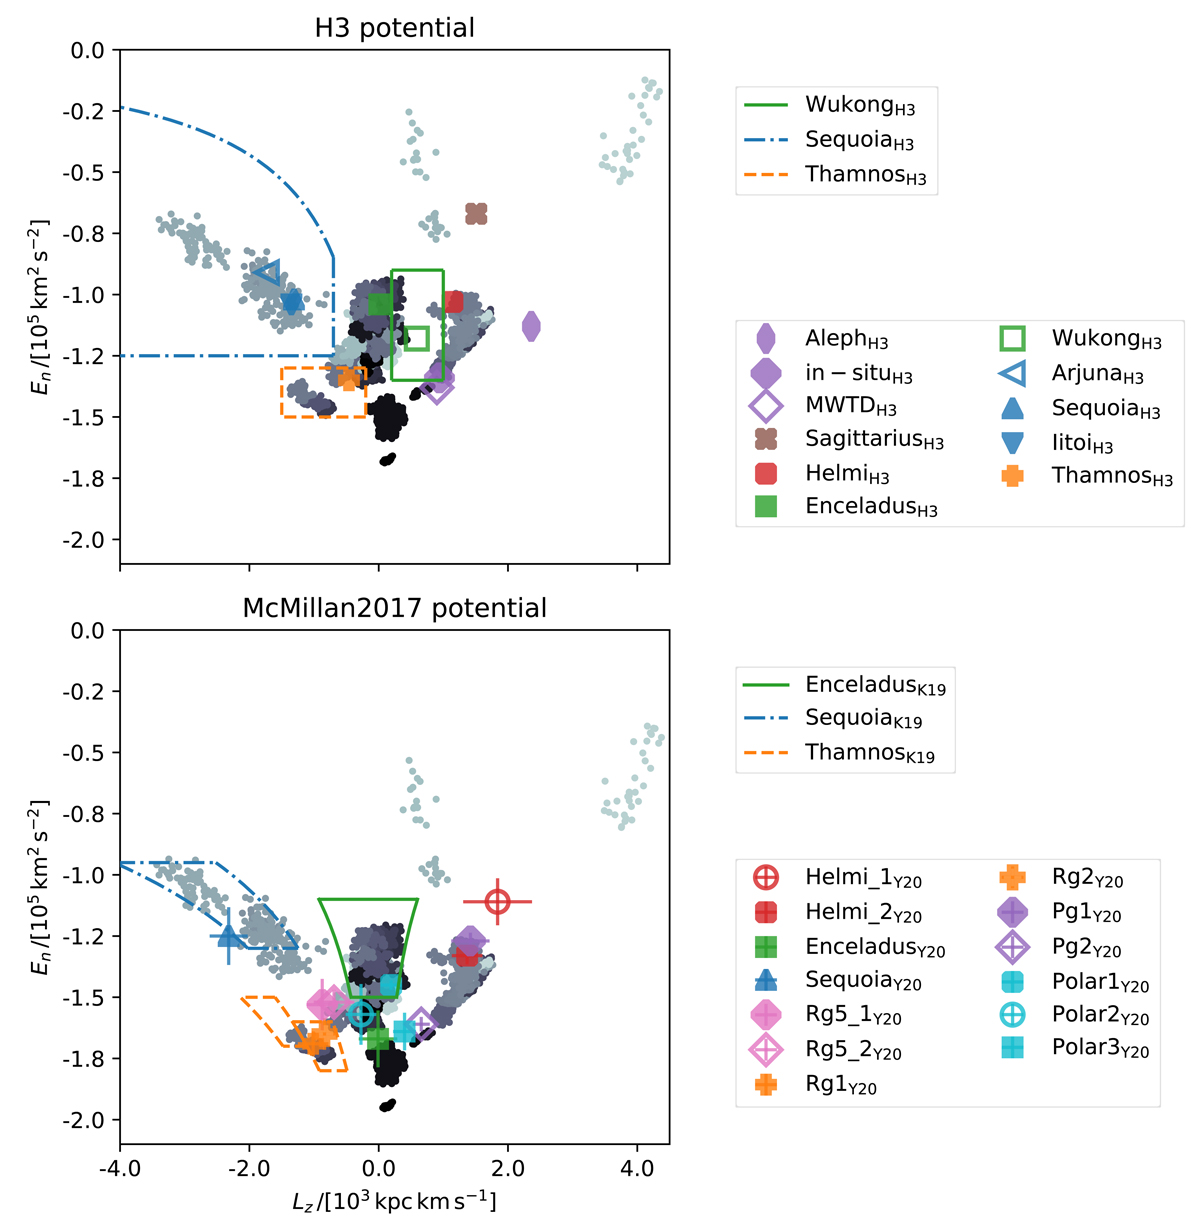
Fig. 13.
Download original image
Comparison of the clusters identified in the present work with those in the literature. The Lz and E of the stars in the clusters were re-calculated for consistent comparisons (see text for details). The upper panel provides a comparison with the results from the H3 survey (Naidu et al. 2020), and the bottom panel presents comparisons with selection boundaries from Koppelman et al. (2019a) and the average kinematic properties of the substructures from Yuan et al. (2020a).
Current usage metrics show cumulative count of Article Views (full-text article views including HTML views, PDF and ePub downloads, according to the available data) and Abstracts Views on Vision4Press platform.
Data correspond to usage on the plateform after 2015. The current usage metrics is available 48-96 hours after online publication and is updated daily on week days.
Initial download of the metrics may take a while.