Open Access
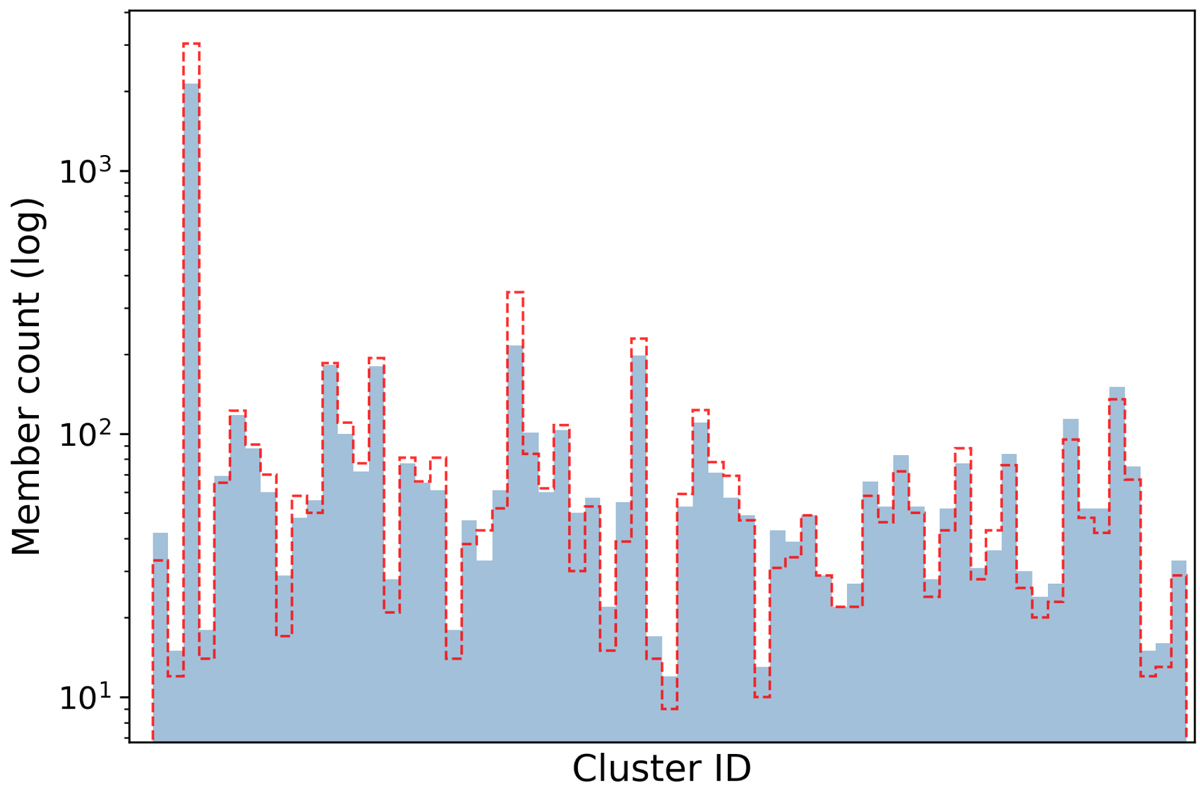
Fig. 6.
Download original image
Histogram of the number of members per cluster. Members identified by the single-linkage algorithm are plotted in solid blue. The dashed red line indicates the sizes when original and additional plausible members are considered within a Mahalanobis distance of Dcut ∼ 2.13 from each cluster centre.
Current usage metrics show cumulative count of Article Views (full-text article views including HTML views, PDF and ePub downloads, according to the available data) and Abstracts Views on Vision4Press platform.
Data correspond to usage on the plateform after 2015. The current usage metrics is available 48-96 hours after online publication and is updated daily on week days.
Initial download of the metrics may take a while.