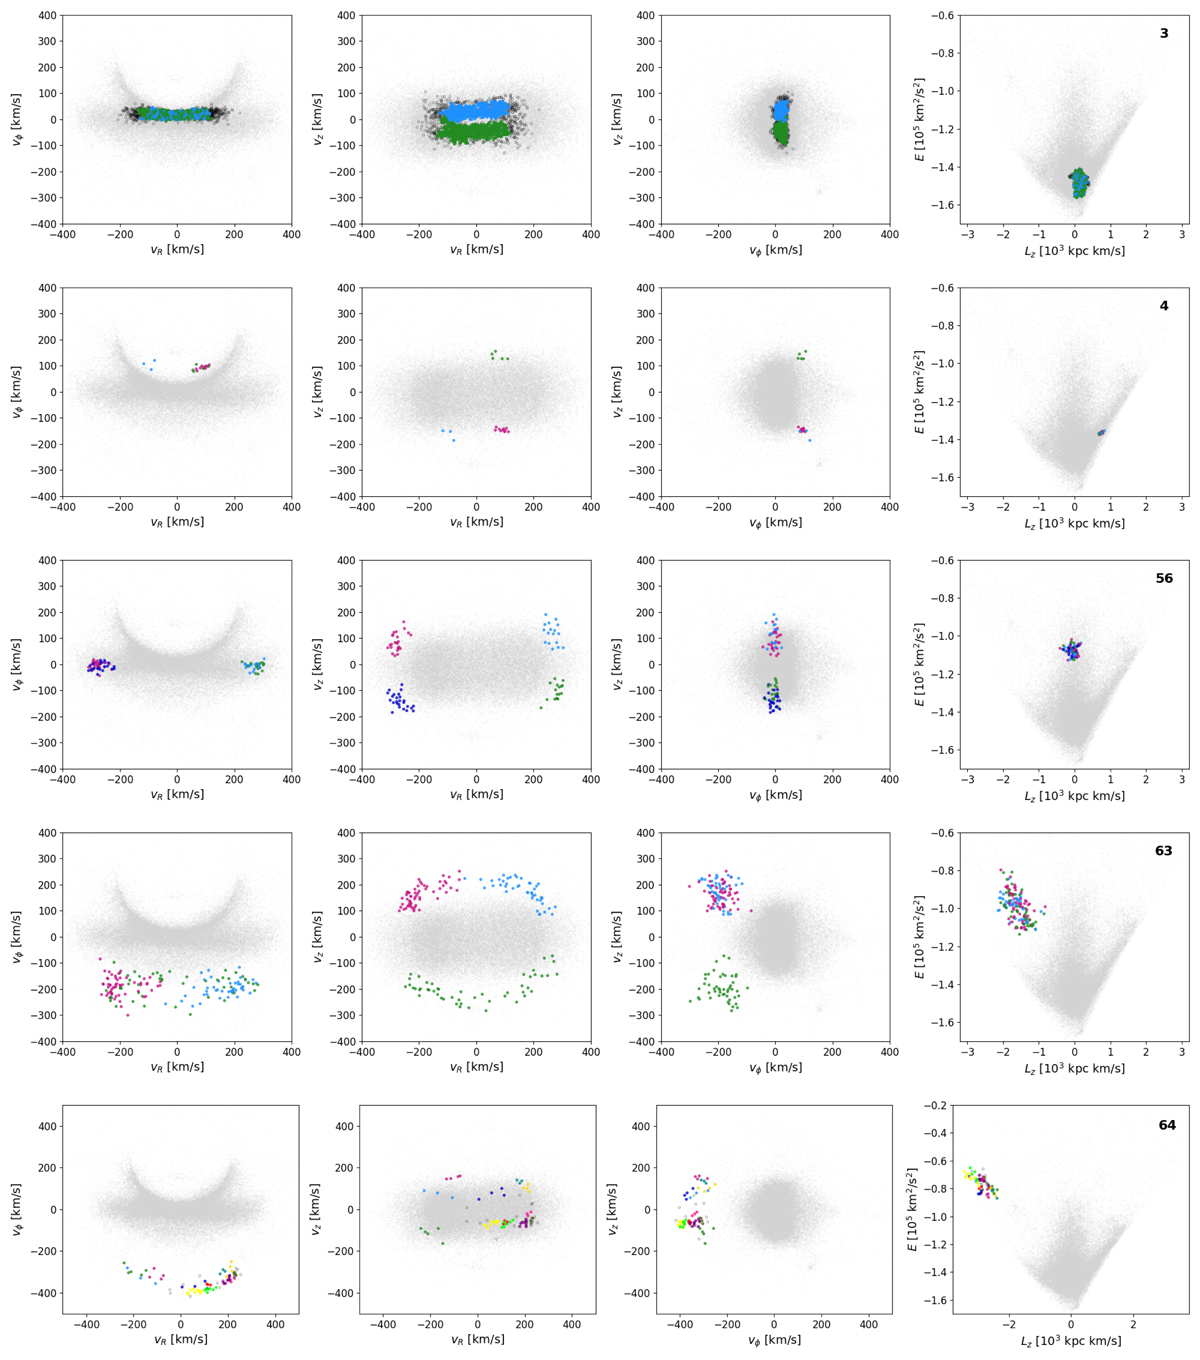
Fig. 7.

Download original image
Subgroups identified by HDBSCAN in velocity space for a selection of five significant clusters from the single-linkage algorithm, where noise as labelled by the algorithm is marked with open black circles. In each row, the three first panels display the projection of the subgroups in velocity space, and the fourth panel shows the location of the ‘parent’ cluster in E − Lz space; its ID is displayed in the upper right corner.
Current usage metrics show cumulative count of Article Views (full-text article views including HTML views, PDF and ePub downloads, according to the available data) and Abstracts Views on Vision4Press platform.
Data correspond to usage on the plateform after 2015. The current usage metrics is available 48-96 hours after online publication and is updated daily on week days.
Initial download of the metrics may take a while.


