Fig. 4
Download original image
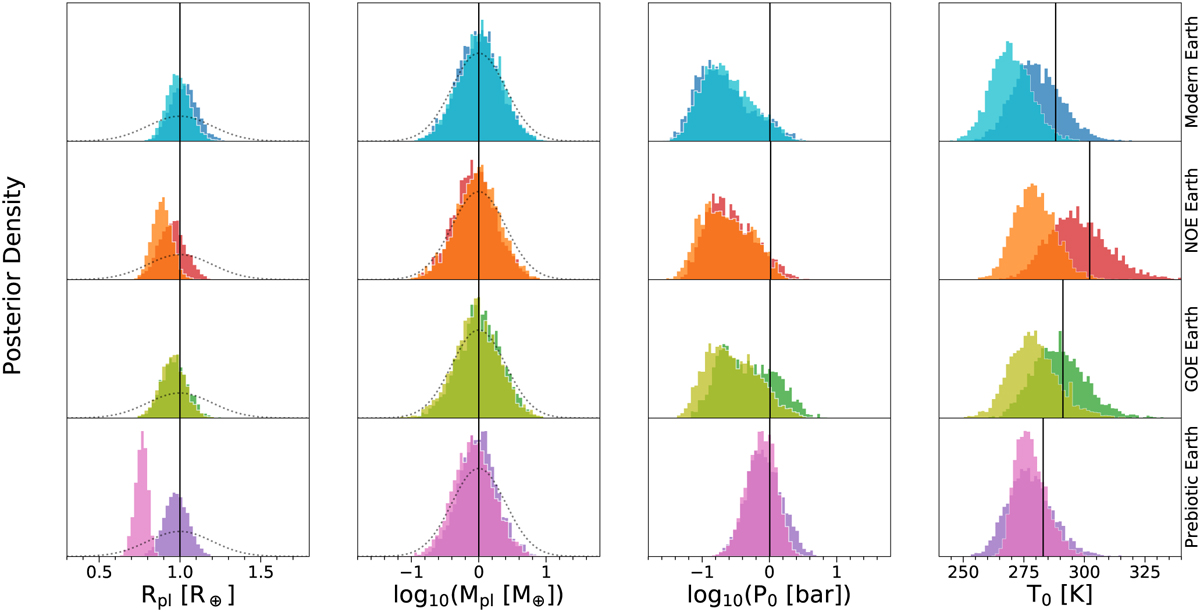
Posterior density distributions for the retrieved exoplanet parameters (columns) for the different epochs (rows) and cloud coverages. We follow the color-coding listed in Table 1 to differentiate the different scenarios. The vertical, solid lines mark the true values for each parameter. The dotted lines in the Rpl and Mpl plots indicate the assumed Gaussian priors. For P0 and T0 we assume broad, flat priors, which are not plotted.
Current usage metrics show cumulative count of Article Views (full-text article views including HTML views, PDF and ePub downloads, according to the available data) and Abstracts Views on Vision4Press platform.
Data correspond to usage on the plateform after 2015. The current usage metrics is available 48-96 hours after online publication and is updated daily on week days.
Initial download of the metrics may take a while.