Open Access
Fig. 6
Download original image
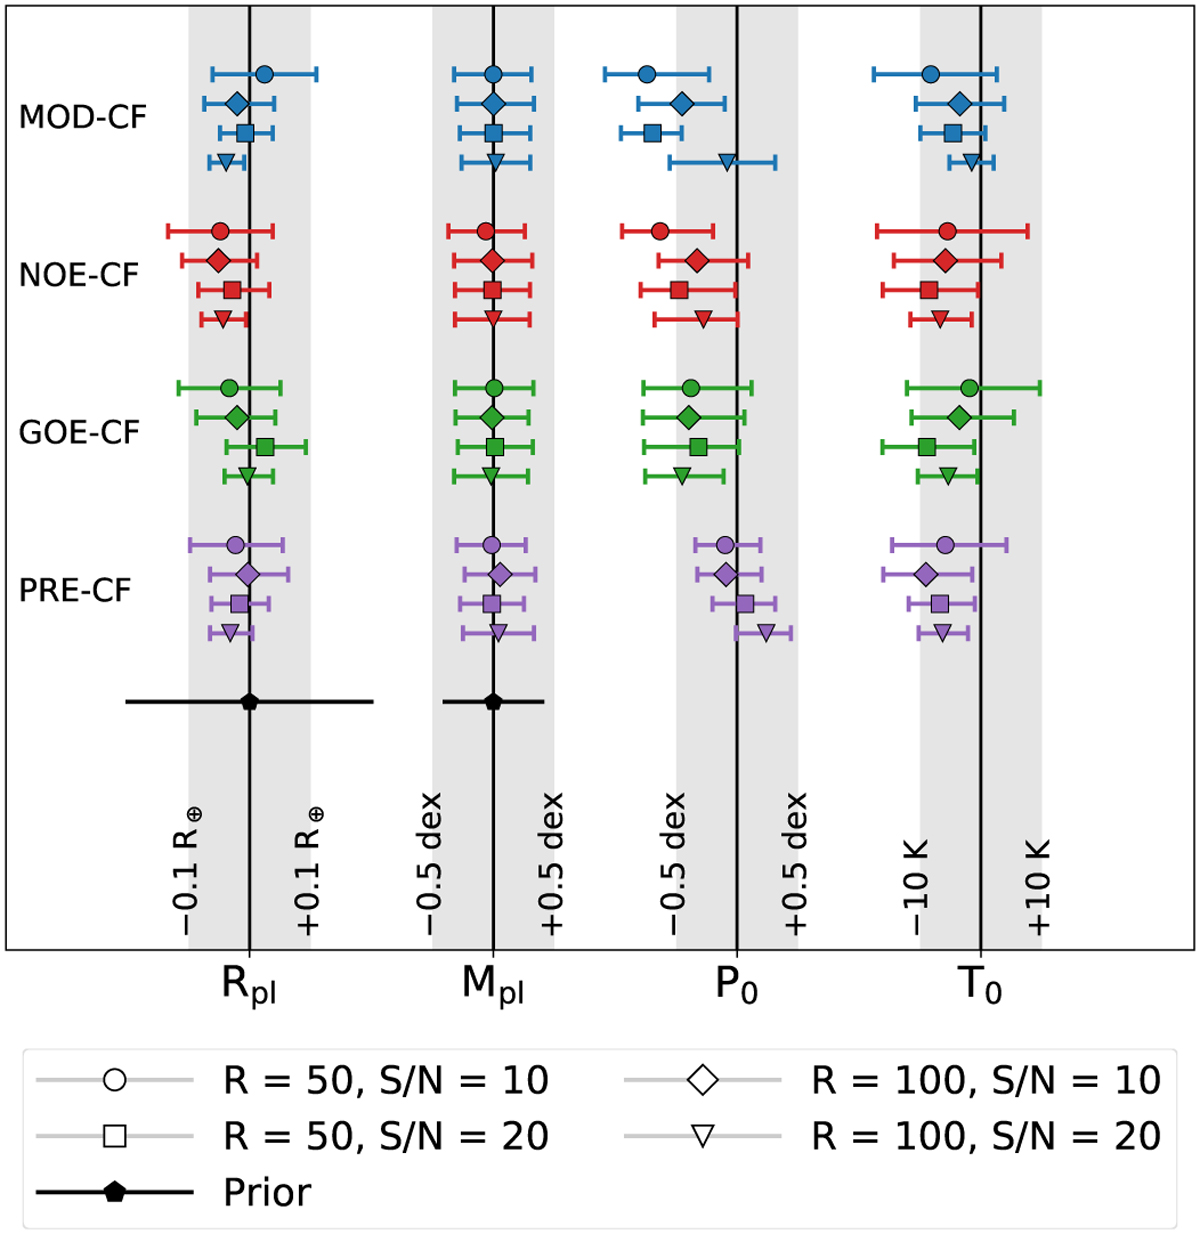
Retrieved exoplanet parameters for the different scenarios with varying R and S/N values. The error bars denote the 68% confidence intervals. For Mpl and Rpl, we also plot the assumed prior distributions. For T0 and P0, we assumed flat, broad priors. The vertical lines mark the true parameter values.
Current usage metrics show cumulative count of Article Views (full-text article views including HTML views, PDF and ePub downloads, according to the available data) and Abstracts Views on Vision4Press platform.
Data correspond to usage on the plateform after 2015. The current usage metrics is available 48-96 hours after online publication and is updated daily on week days.
Initial download of the metrics may take a while.