Fig. 4
Download original image
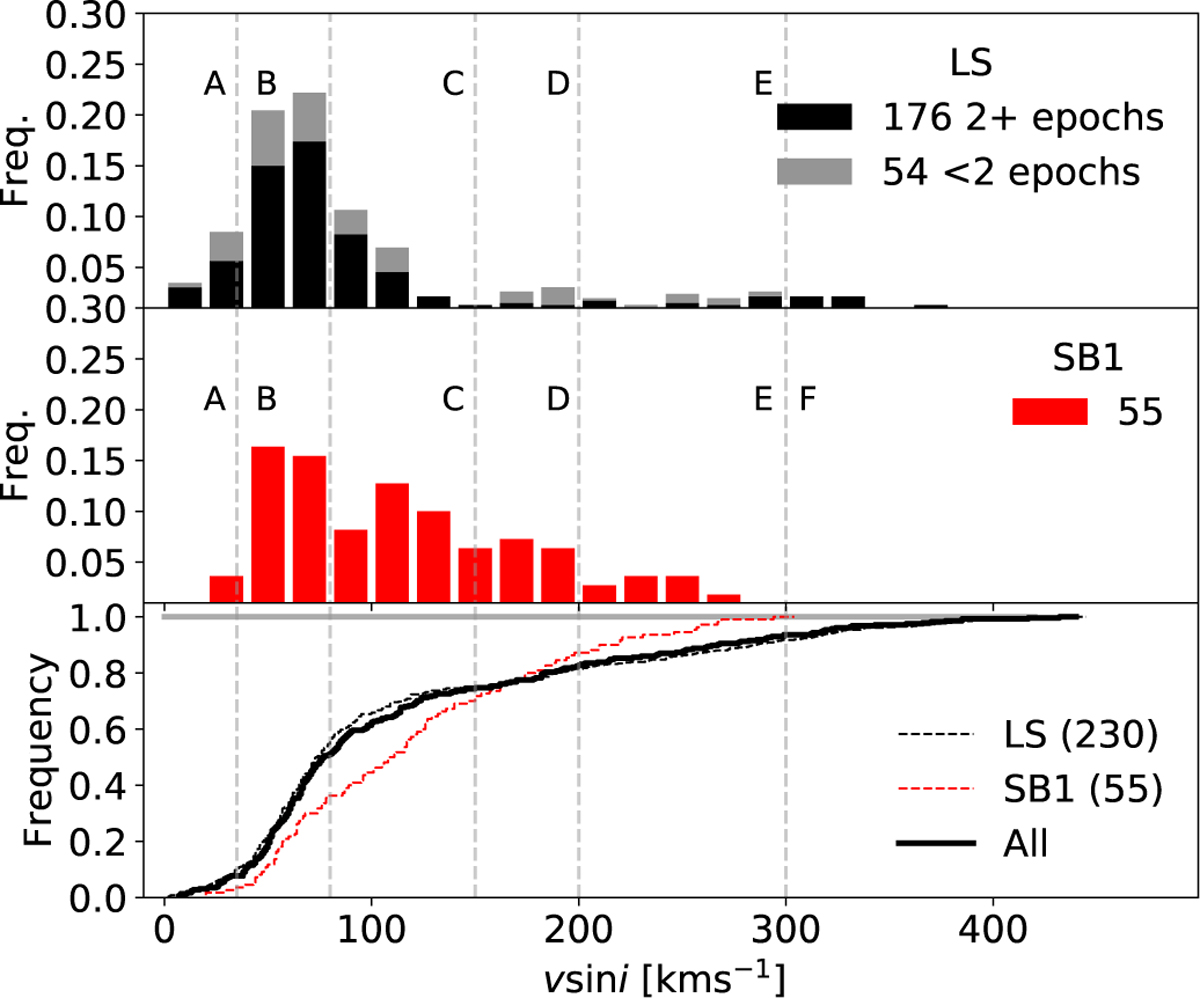
Comparison of the υ sin i distributions of the likely single (LS) and clearly detected SB1 subsamples, presented as histograms (top and middle panels, respectively) and cumulative distributions (bottom panel). Stars in the LS sample, for which we only have one spectrum, are highlighted in gray. Ranges in υ sin i labeled with letters “A” to “F” are used in Fig. 5 and explained in Sect. 3.3.
Current usage metrics show cumulative count of Article Views (full-text article views including HTML views, PDF and ePub downloads, according to the available data) and Abstracts Views on Vision4Press platform.
Data correspond to usage on the plateform after 2015. The current usage metrics is available 48-96 hours after online publication and is updated daily on week days.
Initial download of the metrics may take a while.