Fig. 10.
Download original image
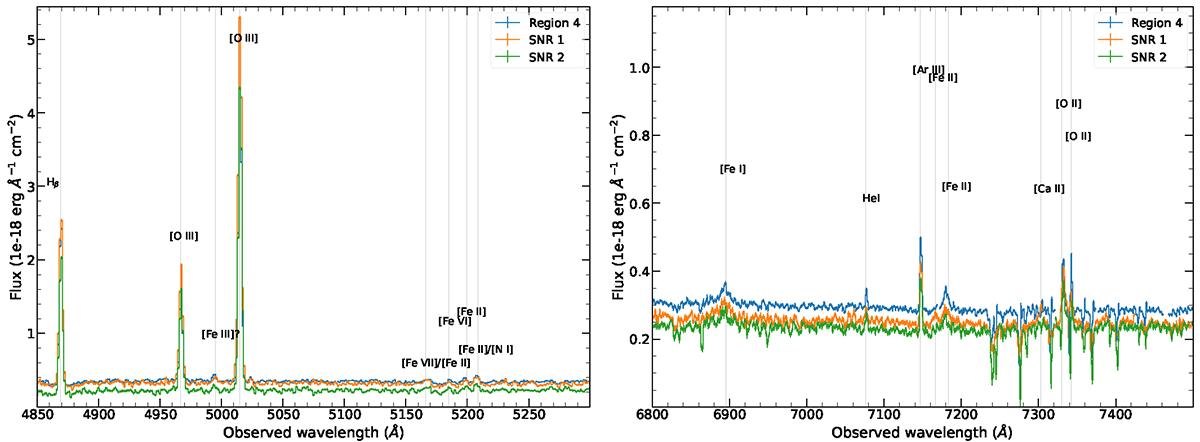
Average spectra extracted from regions SNR 1, SNR 2, and region 4 in Fig. 6 showing the spectral bands in the ranges 4850–5300 Å (left) and 6800–7500 Å (right). The thin vertical lines show the expected transitions at the redshift of NGC 1313 based on the line catalogue from Fesen & Hurford (1996). The spectra have been smoothed with a Gaussian kernel of 2.5 Å. Small gaps mask some pixels having negative values due to low S/N.
Current usage metrics show cumulative count of Article Views (full-text article views including HTML views, PDF and ePub downloads, according to the available data) and Abstracts Views on Vision4Press platform.
Data correspond to usage on the plateform after 2015. The current usage metrics is available 48-96 hours after online publication and is updated daily on week days.
Initial download of the metrics may take a while.