Open Access
Fig. 12.
Download original image
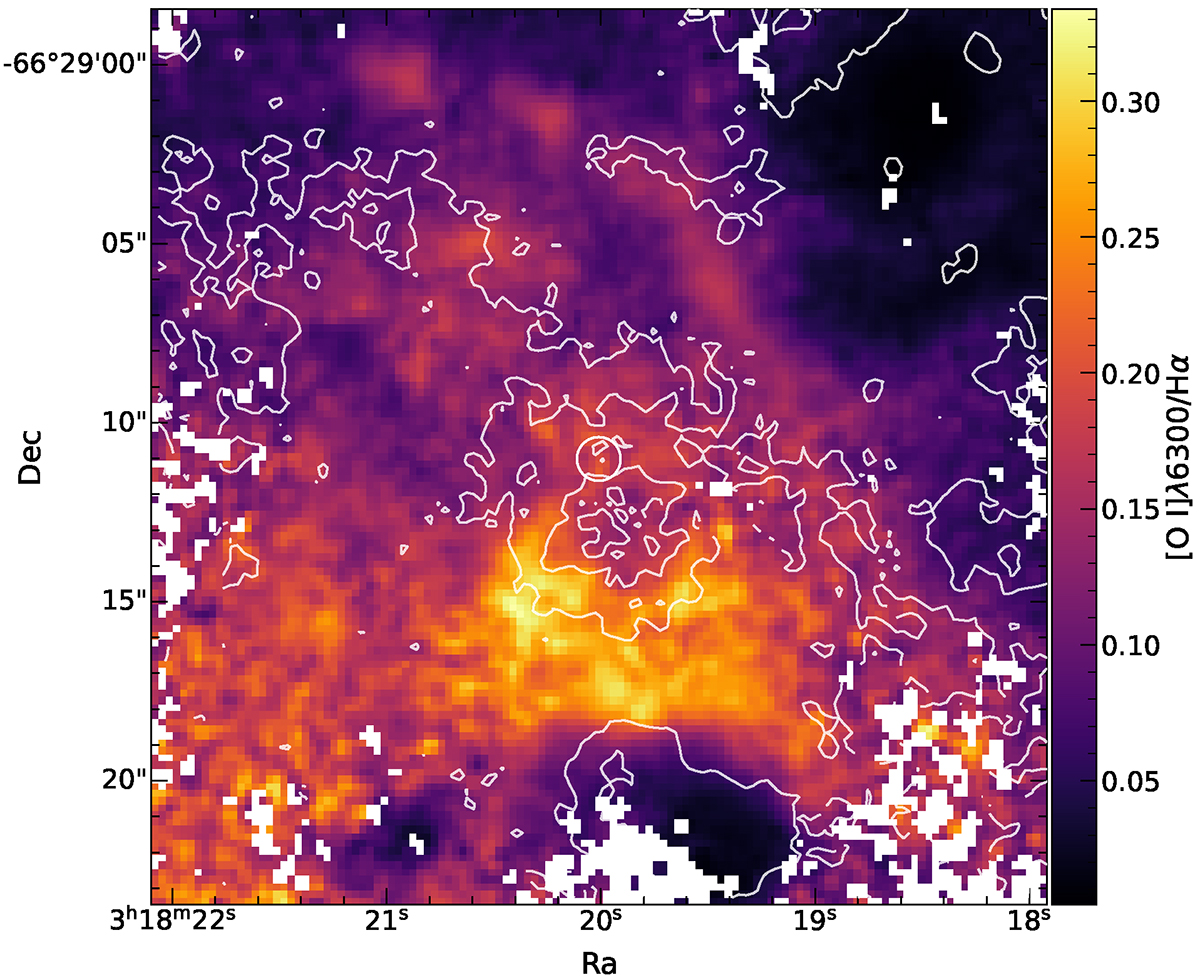
[O I]λ6300/Hα map with the [O III]λ5007/Hβ contours overlaid in white showing a region of 25″ × 25″ around the ULX (white circle). Extended emission with high [O I]λ6300/Hα ratios is seen south to the peak of the [O III]λ5007/Hβ indicating X-ray excitation.
Current usage metrics show cumulative count of Article Views (full-text article views including HTML views, PDF and ePub downloads, according to the available data) and Abstracts Views on Vision4Press platform.
Data correspond to usage on the plateform after 2015. The current usage metrics is available 48-96 hours after online publication and is updated daily on week days.
Initial download of the metrics may take a while.