Fig. 12
Download original image
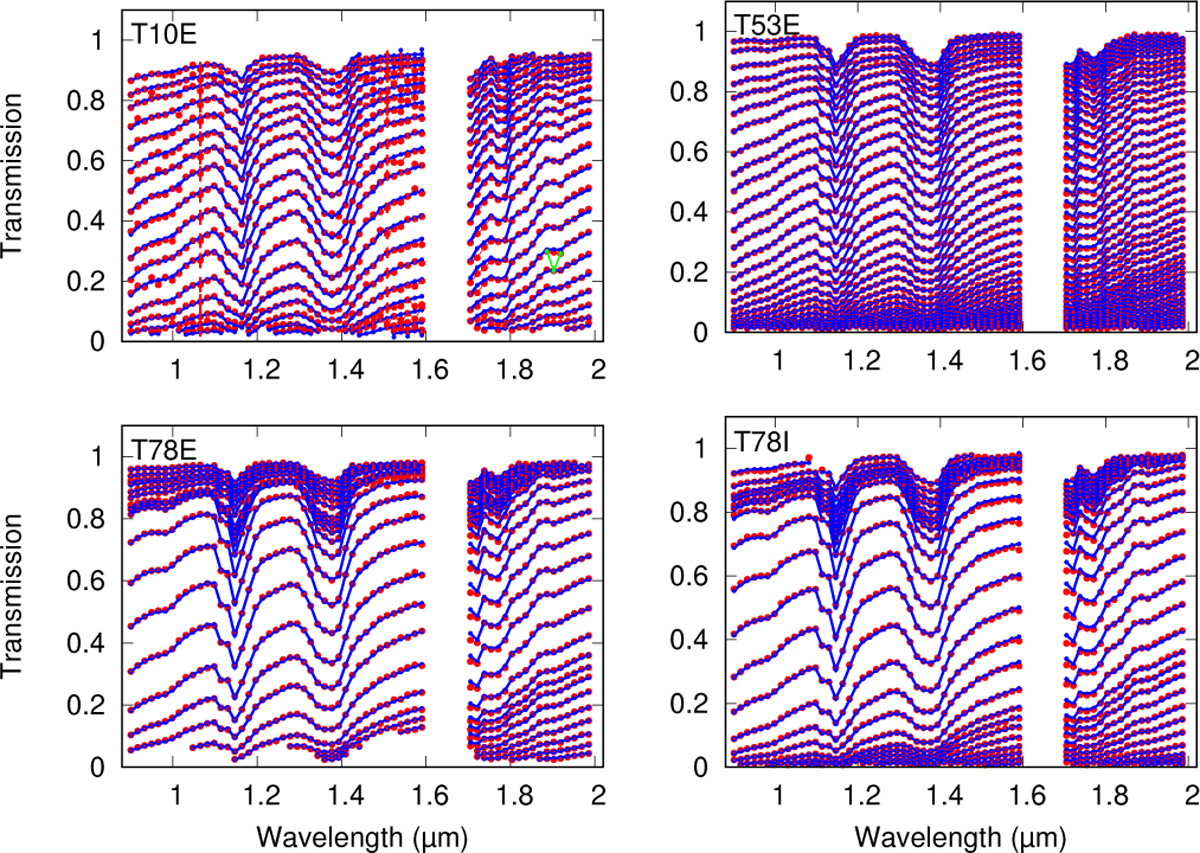
Comparison between observed transmissions (red dots) and the model (blue dots) in the spectral range used to retrieve methane mixing ratio. The spectra between 1.6 and 1.7 µm were not used in this study due to unreliable spectels (RC19). The green dashed lines for the transmission of T10E show the spurious point that was modified.
Current usage metrics show cumulative count of Article Views (full-text article views including HTML views, PDF and ePub downloads, according to the available data) and Abstracts Views on Vision4Press platform.
Data correspond to usage on the plateform after 2015. The current usage metrics is available 48-96 hours after online publication and is updated daily on week days.
Initial download of the metrics may take a while.