Fig. 10.
Download original image
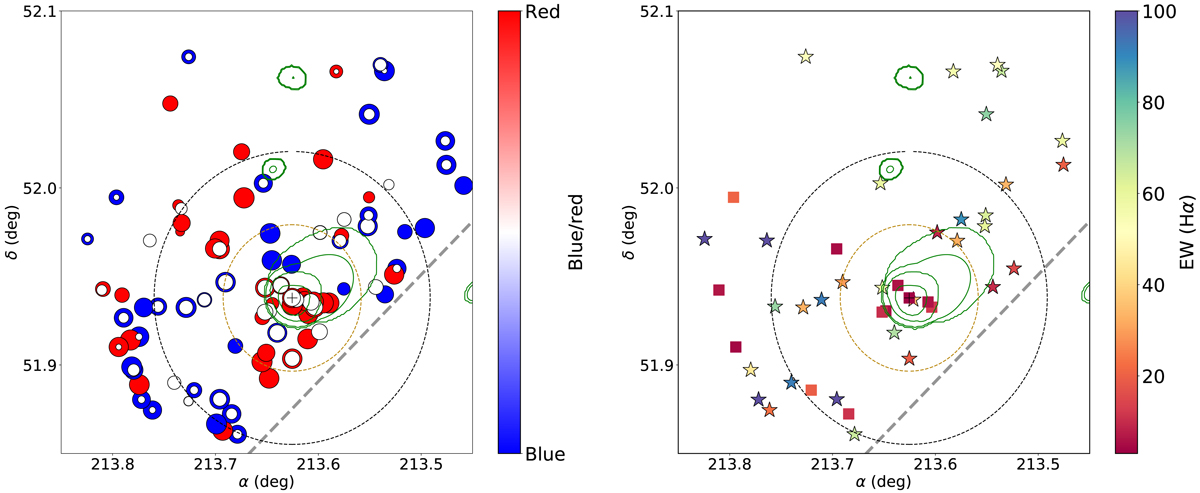
Spatial distribution of the galaxy populations in the cluster. Left panel: spatial distribution of the red, blue, and emission line galaxy populations. Blue dots represent blue galaxies. Red galaxies are represented with red dots. White dots over red and blue dots represent the ELG. Dot size is proportional to the AMICO association probability. The dashed golden and black circles represents the 0.5R200 and R200 distances to the BCG, respectively. The grey dashed line represents the limit of the FoV of miniJPAS. The black cross represents the position of the BCG. Green contours represent the X-ray emission in the 0.5–2 keV energy band from XMM data (Bonoli et al. 2021). Energy levels are 3.654 × 10⁻¹⁶, 1.218 × 10⁻¹⁵, 3.654 × 10⁻¹⁵ and 1.218 × 10⁻¹⁴ ergs s−1 cm−2 arcmin−2. Rigt panel: spatial distribution of the SF and AGN. Stars represent SF galaxies and squares the AGNs. The color code represent the inferred EW(Hα). The rest of the symbols are the same as in the left panel.
Current usage metrics show cumulative count of Article Views (full-text article views including HTML views, PDF and ePub downloads, according to the available data) and Abstracts Views on Vision4Press platform.
Data correspond to usage on the plateform after 2015. The current usage metrics is available 48-96 hours after online publication and is updated daily on week days.
Initial download of the metrics may take a while.