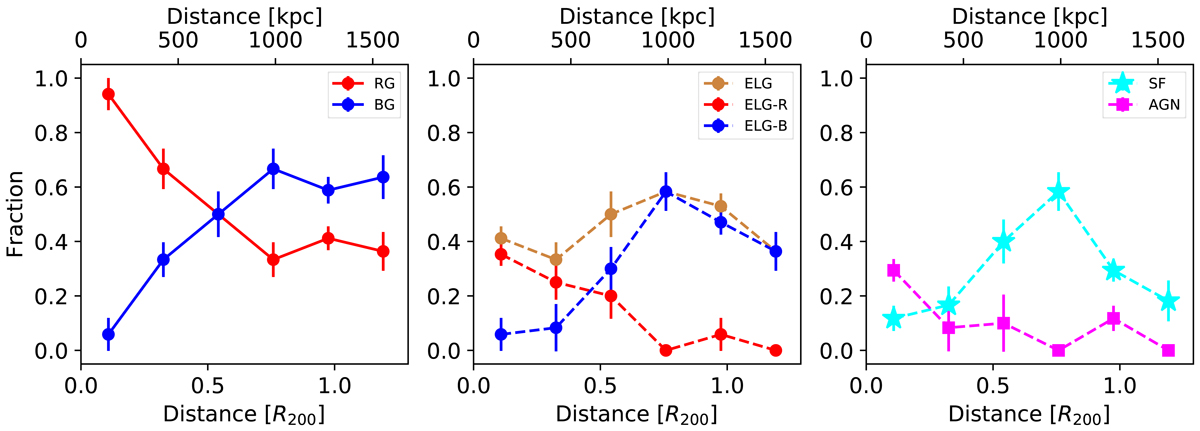
Fig. 11.
Download original image
Radial variation of the galaxy populations in the cluster. First panel: radial variation of the fraction of red and blue galaxies. Red points represent the fraction of red galaxies, blue points represent the fraction of blue galaxies. Second panel: fraction of ELG, red ELG, and blue ELG as a function of distance. Peru points are the total fraction of ELG, red points are the fraction of red ELG, and blue points are the fraction of blue ELG. Third panel: fraction of SF galaxies and AGNs as a function of the distance to the BCG. Cyan stars represent the fraction of star-forming galaxies. Magenta squares represent the fraction of AGN.
Current usage metrics show cumulative count of Article Views (full-text article views including HTML views, PDF and ePub downloads, according to the available data) and Abstracts Views on Vision4Press platform.
Data correspond to usage on the plateform after 2015. The current usage metrics is available 48-96 hours after online publication and is updated daily on week days.
Initial download of the metrics may take a while.