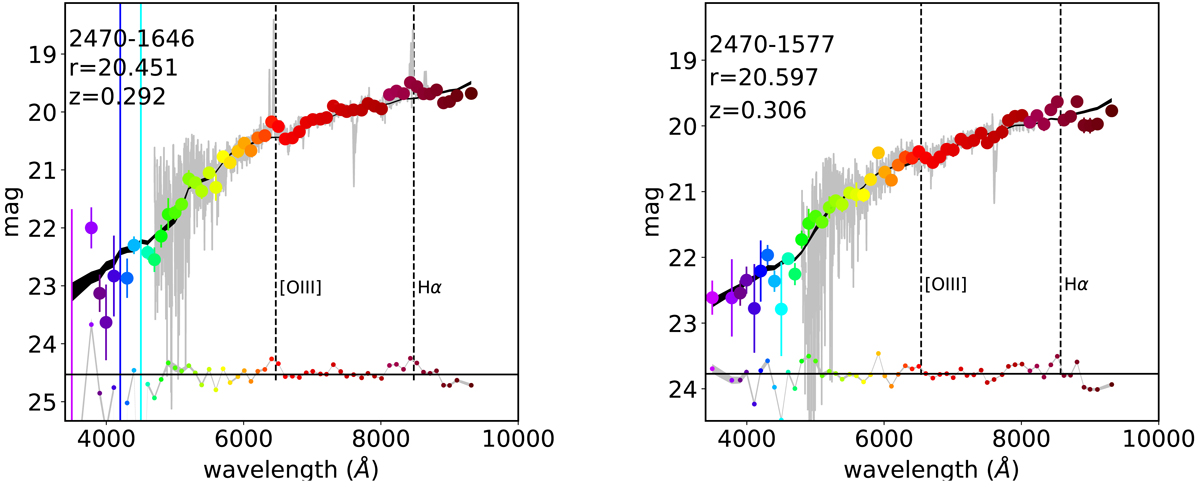
Fig. B.1.
Download original image
Comparison among the J-spectra and the GMOS spectra of two galaxies belonging to the cluster. Colour points represent the J-spectra. Grey lines represent the GMOS spectra. The black band shows the magnitudes of the mean model ± one σ uncertainty level. The difference between the model and the mean model fitted magnitudes are plotted as a small coloured points around the black bottom line. Vertical, black dashed lines show the wavelengths corresponding to [OIII] and Hα emission lines.
Current usage metrics show cumulative count of Article Views (full-text article views including HTML views, PDF and ePub downloads, according to the available data) and Abstracts Views on Vision4Press platform.
Data correspond to usage on the plateform after 2015. The current usage metrics is available 48-96 hours after online publication and is updated daily on week days.
Initial download of the metrics may take a while.