Fig. C.1.
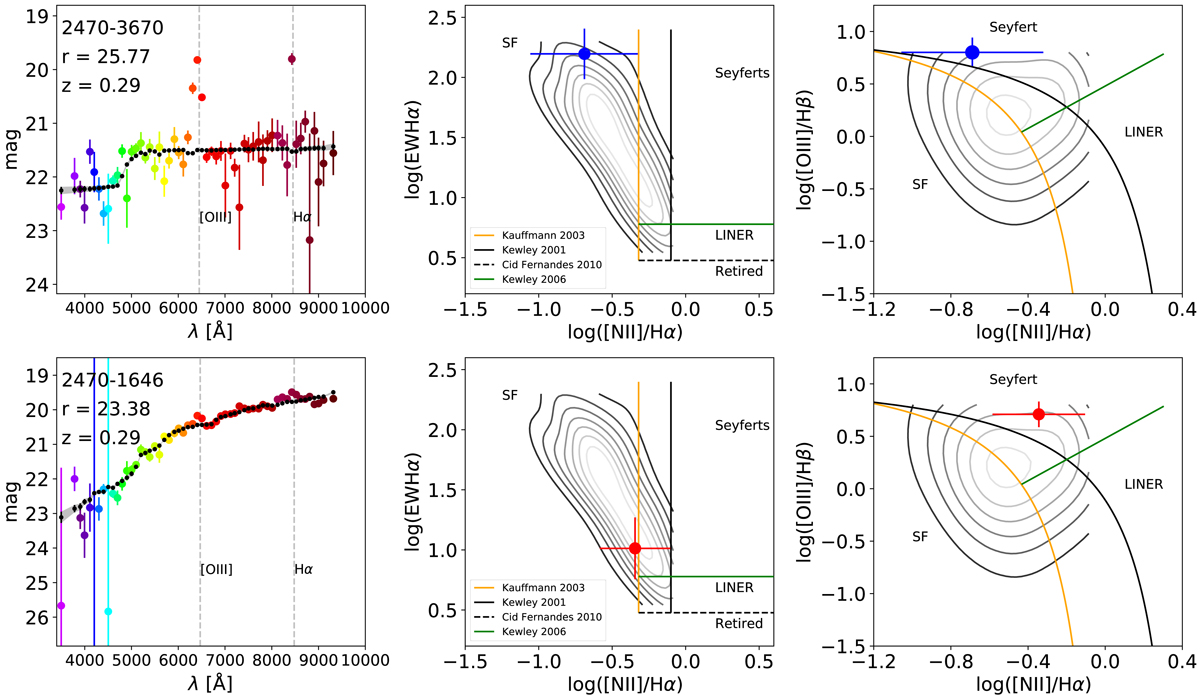
Download original image
Example of a star-forming galaxy (top row) and a Seyfert galaxy (bottom row). From left to right, the panels in each galaxy show the spectra and its position in the WHAN and BPT diagrams (where the contours represent this work’s galaxy density in each diagram). The solid orange and black lines represent the Cid Fernandes et al. (2010) transposition of the Kauffmann et al. (2003a) and Kewley et al. (2001) SF-AGN distiction criteria, and the green solid line represents the transposition of the Kewley et al. (2006) made by Cid Fernandes et al. (2010). The dashed black line represents the distinction between retired galaxies and LINERs (Cid Fernandes et al. 2011).
Current usage metrics show cumulative count of Article Views (full-text article views including HTML views, PDF and ePub downloads, according to the available data) and Abstracts Views on Vision4Press platform.
Data correspond to usage on the plateform after 2015. The current usage metrics is available 48-96 hours after online publication and is updated daily on week days.
Initial download of the metrics may take a while.