Fig. 3.
Download original image
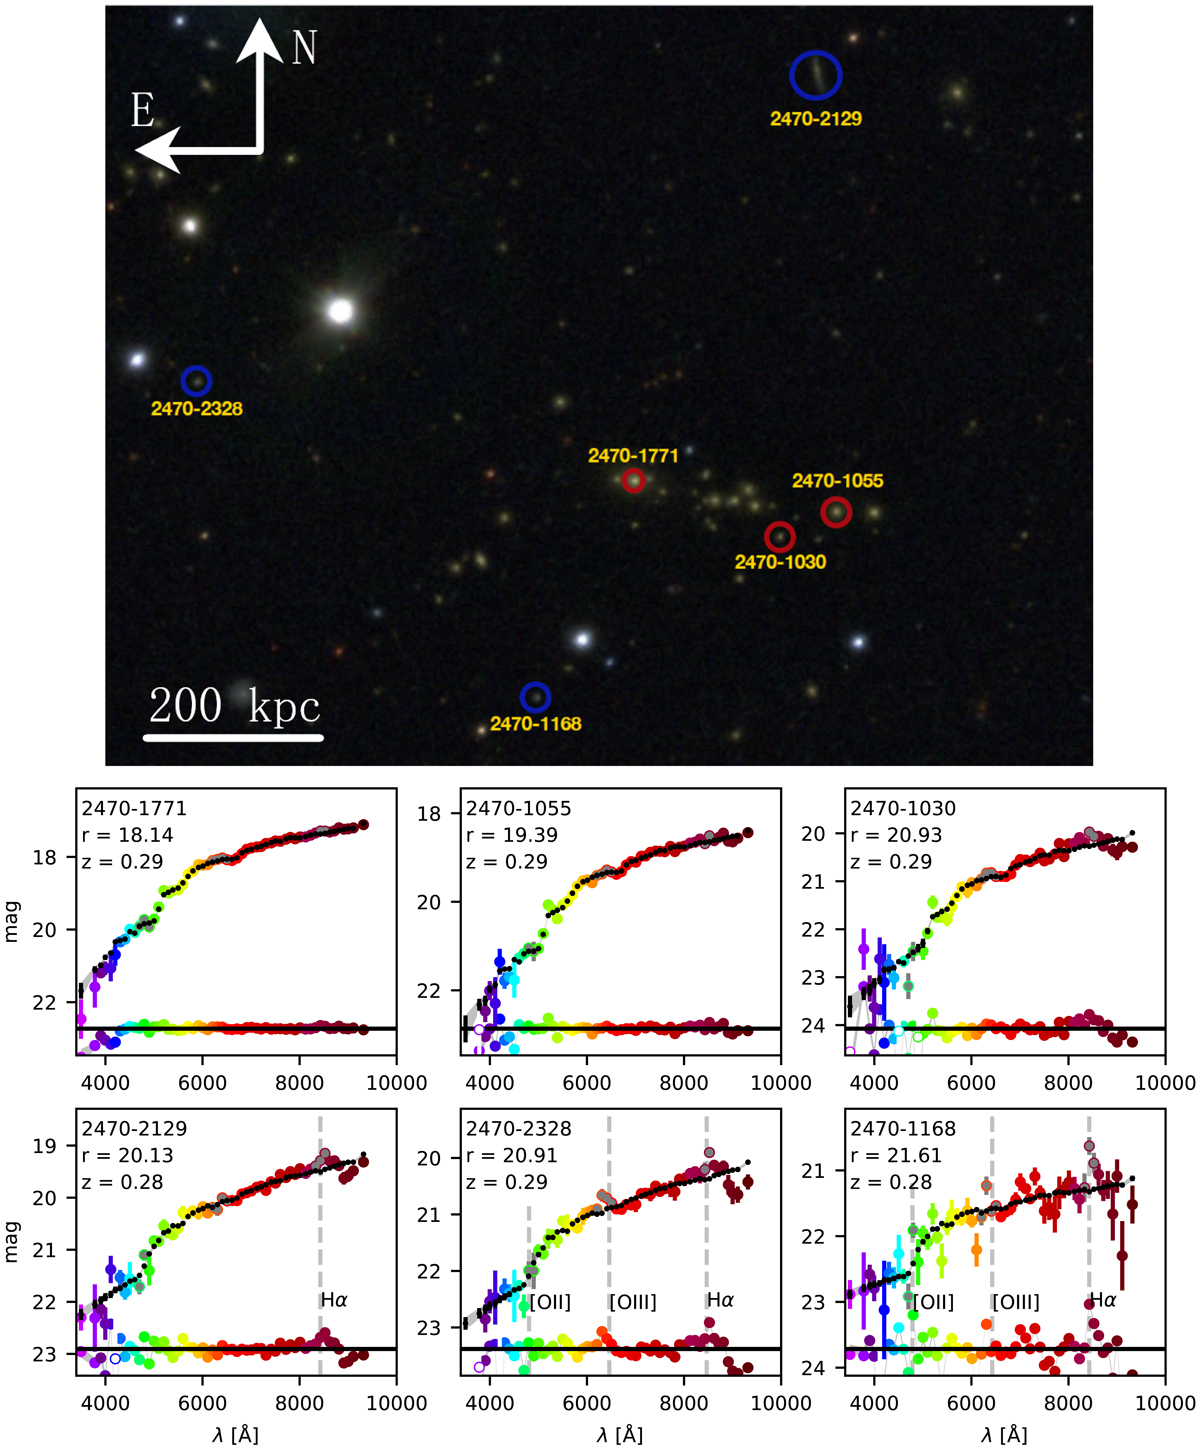
mJPC2470-1771 and J-spectra examples. Top panel: miniJPAS view of mJPC2470-1771. Prominent red and blue galaxies in the cluster are marked with red and blue circles, respectively. The BCG corresponds to 2470-1771, with an spectroscopic redshift of z = 0.289. Bottom panel: MAG_PSFCOR J-spectra of three red galaxies (top row) and three blue galaxies (bottom row) that are marked with circles in the top panel. The mean model fitted by BaySeAGal is plotted as black points, and the grey band shows the magnitudes of the mean model ± one σ uncertainty level. The difference between the model and the best model fitted magnitudes are plotted as a small coloured points around the black bottom line. Masked filter (white coloured circles) and filters overlapping with the emission lines Hα, [NII], [OIII], Hβ, and [OII] (darker grey coloured circles) are not used in the fit. Grey vertical dashed lines show the wavelengths corresponding to detectable emission lines.
Current usage metrics show cumulative count of Article Views (full-text article views including HTML views, PDF and ePub downloads, according to the available data) and Abstracts Views on Vision4Press platform.
Data correspond to usage on the plateform after 2015. The current usage metrics is available 48-96 hours after online publication and is updated daily on week days.
Initial download of the metrics may take a while.